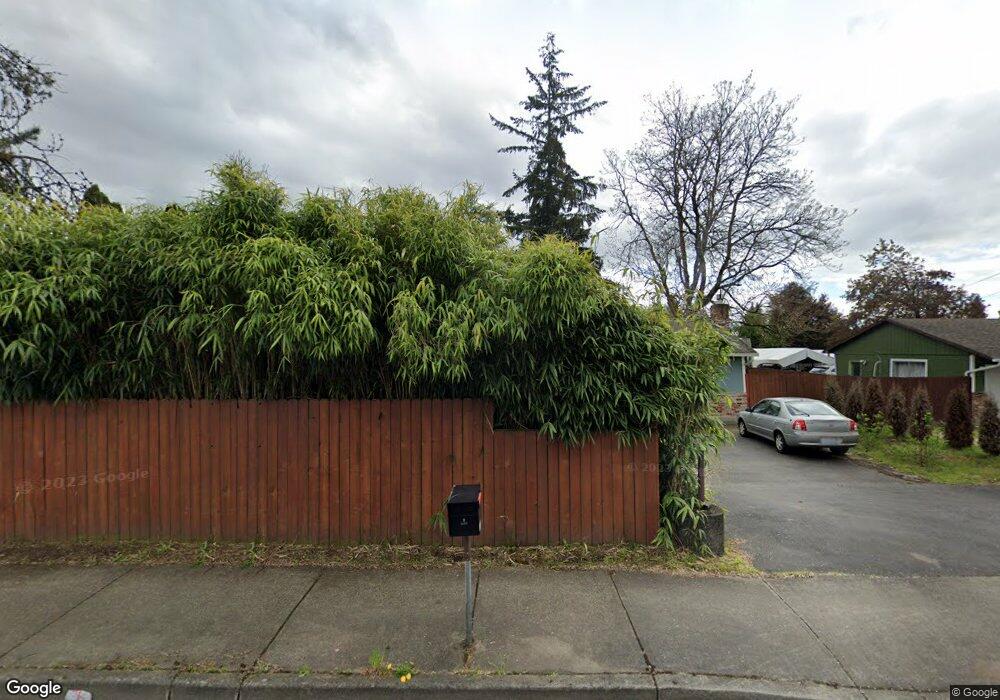
10911 NE 76th St Vancouver, WA 98662
Orchards Area NeighborhoodEstimated Value: $420,000 - $481,608
3
Beds
2
Baths
1,508
Sq Ft
$304/Sq Ft
Est. Value
About This Home
This home is located at 10911 NE 76th St, Vancouver, WA 98662 and is currently estimated at $458,152, approximately $303 per square foot. 10911 NE 76th St is a home located in Clark County with nearby schools including Orchards Elementary School, Covington Middle School, and Heritage High School.
Ownership History
Date
Name
Owned For
Owner Type
Purchase Details
Closed on
Mar 16, 2006
Sold by
Avery Bryan A
Bought by
Wallace Nathaniel R and Liebl Wallace Manuela L
Current Estimated Value
Home Financials for this Owner
Home Financials are based on the most recent Mortgage that was taken out on this home.
Original Mortgage
$139,500
Outstanding Balance
$89,709
Interest Rate
8.62%
Mortgage Type
Stand Alone First
Estimated Equity
$368,443
Purchase Details
Closed on
May 18, 2004
Sold by
Gardner Theitus and Gardner Hazel M
Bought by
Avery Bryan A
Home Financials for this Owner
Home Financials are based on the most recent Mortgage that was taken out on this home.
Original Mortgage
$128,250
Interest Rate
3.75%
Mortgage Type
Purchase Money Mortgage
Purchase Details
Closed on
Jul 12, 1999
Sold by
Gardner Theitus and Gardner Hazel M
Bought by
Gardner Theitus and Gardner Hazel M
Create a Home Valuation Report for This Property
The Home Valuation Report is an in-depth analysis detailing your home's value as well as a comparison with similar homes in the area
Home Values in the Area
Average Home Value in this Area
Purchase History
| Date | Buyer | Sale Price | Title Company |
|---|---|---|---|
| Wallace Nathaniel R | $155,000 | Fidelity National Title | |
| Avery Bryan A | $135,000 | Clark County Title | |
| Gardner Theitus | -- | -- |
Source: Public Records
Mortgage History
| Date | Status | Borrower | Loan Amount |
|---|---|---|---|
| Open | Wallace Nathaniel R | $139,500 | |
| Previous Owner | Avery Bryan A | $128,250 |
Source: Public Records
Tax History Compared to Growth
Tax History
| Year | Tax Paid | Tax Assessment Tax Assessment Total Assessment is a certain percentage of the fair market value that is determined by local assessors to be the total taxable value of land and additions on the property. | Land | Improvement |
|---|---|---|---|---|
| 2025 | $4,338 | $427,441 | $196,640 | $230,801 |
| 2024 | $4,066 | $424,335 | $196,640 | $227,695 |
| 2023 | $3,906 | $419,451 | $195,160 | $224,291 |
| 2022 | $3,532 | $396,763 | $186,280 | $210,483 |
| 2021 | $3,226 | $333,932 | $155,200 | $178,732 |
| 2020 | $3,379 | $286,786 | $133,000 | $153,786 |
| 2019 | $2,931 | $302,056 | $153,600 | $148,456 |
| 2018 | $3,220 | $282,581 | $0 | $0 |
| 2017 | $2,859 | $250,967 | $0 | $0 |
| 2016 | $2,539 | $232,518 | $0 | $0 |
| 2015 | $2,418 | $191,858 | $0 | $0 |
| 2014 | -- | $173,795 | $0 | $0 |
| 2013 | -- | $156,972 | $0 | $0 |
Source: Public Records
Map
Nearby Homes
- 7817 NE 107th Ave
- 7215 NE 105th Ave
- 11515 NE 71st St Unit 11
- 11515 NE 71st St Unit 70
- 10703 NE 70th St
- 10611 NE 85th Cir
- 10418 NE 66th St
- 11215 NE 85th Cir
- 10915 NE 86th Way
- 10503 NE 88th St
- 10409 NE 63rd Cir
- 9604 NE 83rd Cir
- 11309 NE Conifer Dr
- 8100 NE 94th Ave
- 9217 NE 81st Loop
- 10105 NE 61st Cir
- 11009 NE Fourth Plain Blvd
- 9111 NE 73rd St
- 10213 NE 58th St
- 12801 NE 83rd St
- 10907 NE 76th St
- 10912 NE 75th St
- 10904 NE 75th St
- 7519 NE 109th Ave
- 7513 NE 109th Ave
- 10900 NE 75th St
- 10915 NE 77th Cir
- 11001 NE 77th Cir
- 10911 NE 77th Cir
- 7417 NE 110th Ave
- 11005 NE 77th Cir
- 7501 NE 109th Ave
- 10907 NE 77th Cir
- 0 NE 110th Ave Unit 11312982
- 400 NE 109th Ave Unit 181
- 7411 NE 110th Ave
- 7514 NE 109th Ave
- 10812 NE 76th St
- 7506 NE 109th Ave