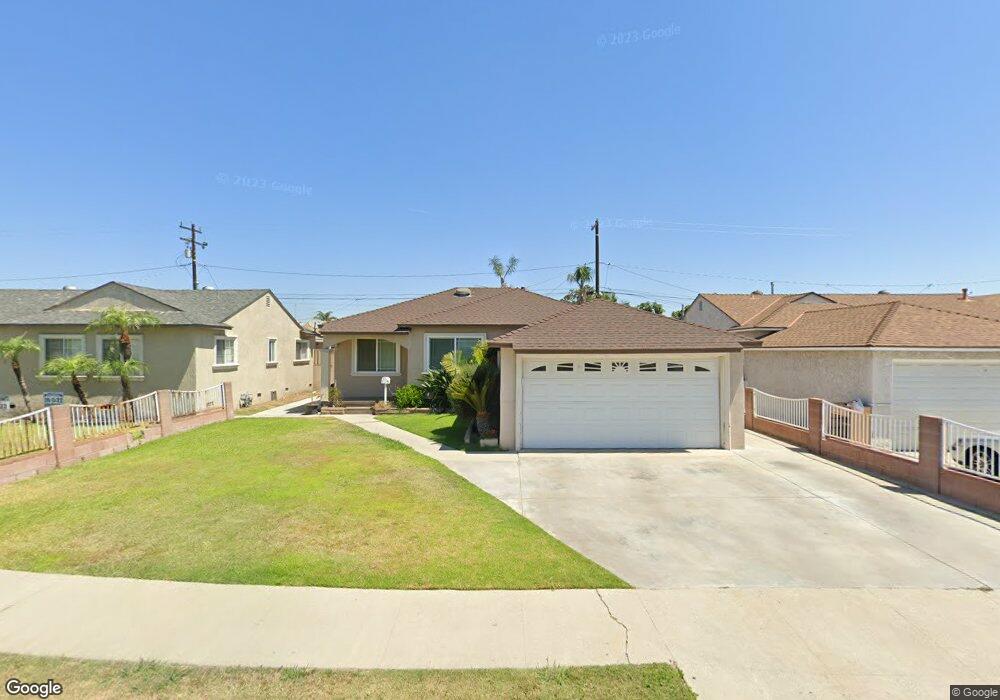
10915 Ratliffe St Norwalk, CA 90650
Estimated Value: $700,130 - $747,000
3
Beds
1
Bath
1,110
Sq Ft
$655/Sq Ft
Est. Value
About This Home
This home is located at 10915 Ratliffe St, Norwalk, CA 90650 and is currently estimated at $726,783, approximately $654 per square foot. 10915 Ratliffe St is a home located in Los Angeles County with nearby schools including New River Elementary School, Corvallis Middle School, and Norwalk High School.
Ownership History
Date
Name
Owned For
Owner Type
Purchase Details
Closed on
Sep 10, 2021
Sold by
Antonio Diaz Marco and Santaella Nancy
Bought by
Diaz Stephanie
Current Estimated Value
Purchase Details
Closed on
May 9, 2005
Sold by
Harris Janet and Harris Jon
Bought by
Harris Jon and Harris Janet
Purchase Details
Closed on
Dec 30, 1998
Sold by
Huff Michael K
Bought by
Huff Janet
Home Financials for this Owner
Home Financials are based on the most recent Mortgage that was taken out on this home.
Original Mortgage
$80,000
Interest Rate
7.05%
Purchase Details
Closed on
Dec 18, 1998
Sold by
Janet L Huff
Bought by
Huff Janet and Harris Jon
Home Financials for this Owner
Home Financials are based on the most recent Mortgage that was taken out on this home.
Original Mortgage
$80,000
Interest Rate
7.05%
Purchase Details
Closed on
Feb 5, 1997
Sold by
Est Of Huff Donald K Gdn Janet L Huff Min
Bought by
Huff Janet L
Create a Home Valuation Report for This Property
The Home Valuation Report is an in-depth analysis detailing your home's value as well as a comparison with similar homes in the area
Home Values in the Area
Average Home Value in this Area
Purchase History
| Date | Buyer | Sale Price | Title Company |
|---|---|---|---|
| Diaz Stephanie | -- | Stewart Title Of California In | |
| Harris Jon | -- | First American Title Ins | |
| Huff Janet | -- | Orange Coast Title | |
| Huff Janet | -- | Orange Coast Title | |
| Huff Janet L | -- | -- |
Source: Public Records
Mortgage History
| Date | Status | Borrower | Loan Amount |
|---|---|---|---|
| Previous Owner | Huff Janet | $80,000 |
Source: Public Records
Tax History Compared to Growth
Tax History
| Year | Tax Paid | Tax Assessment Tax Assessment Total Assessment is a certain percentage of the fair market value that is determined by local assessors to be the total taxable value of land and additions on the property. | Land | Improvement |
|---|---|---|---|---|
| 2025 | $3,023 | $206,493 | $97,965 | $108,528 |
| 2024 | $3,023 | $202,445 | $96,045 | $106,400 |
| 2023 | $2,929 | $198,476 | $94,162 | $104,314 |
| 2022 | $2,879 | $194,585 | $92,316 | $102,269 |
| 2021 | $2,837 | $190,770 | $90,506 | $100,264 |
| 2019 | $2,760 | $185,113 | $87,822 | $97,291 |
| 2018 | $2,607 | $181,484 | $86,100 | $95,384 |
| 2016 | $2,492 | $174,438 | $82,757 | $91,681 |
| 2015 | $2,469 | $171,818 | $81,514 | $90,304 |
| 2014 | $2,314 | $168,454 | $79,918 | $88,536 |
Source: Public Records
Map
Nearby Homes
- 10917 Foster Rd
- 12716 Fairford Ave
- 12628 Fairford Ave
- 11101 Imperial Hwy Unit 129
- 11101 Imperial Hwy Unit 122
- 10922 Tolly St
- 12608 Longworth Ave
- 10855 Leffingwell Rd
- 10844 Tonibar St
- 12809 Curtis And King Rd
- 12824 Orr And Day Rd
- 12714 Orr And Day Rd
- 11408 Foster Rd
- 11457 Maza St
- 11903 Fairford Ave
- 13936 Edgewater Dr Unit 122
- 13623 Roseton Ave
- 12028 Summer Ave
- 12063 Newmire Ave
- 11818 Graystone Ave
- 10921 Ratliffe St
- 10909 Ratliffe St
- 10925 Ratliffe St
- 10934 Adoree St
- 10930 Adoree St
- 10940 Adoree St
- 10905 Ratliffe St
- 10924 Adoree St
- 10914 Ratliffe St
- 10944 Adoree St
- 10931 Ratliffe St
- 10920 Ratliffe St
- 10908 Ratliffe St
- 10924 Ratliffe St
- 10901 Ratliffe St
- 10920 Adoree St
- 10950 Adoree St
- 10939 Ratliffe St
- 10904 Ratliffe St
- 10930 Ratliffe St