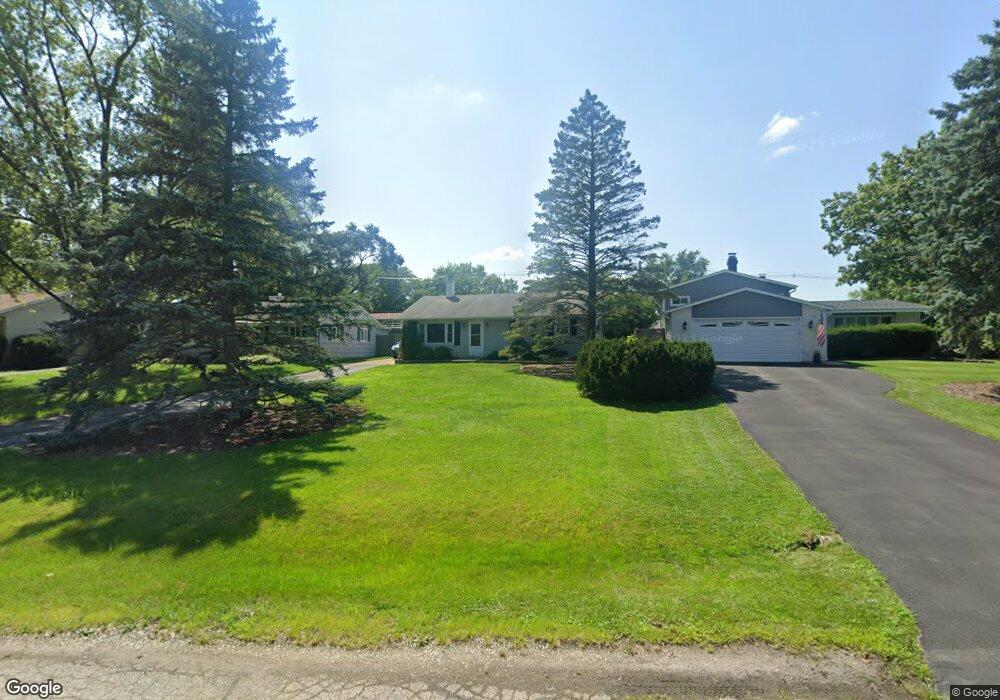
1092 Highland Rd Mundelein, IL 60060
Loch Lomond NeighborhoodEstimated Value: $285,000 - $317,000
3
Beds
1
Bath
1,198
Sq Ft
$254/Sq Ft
Est. Value
About This Home
This home is located at 1092 Highland Rd, Mundelein, IL 60060 and is currently estimated at $304,429, approximately $254 per square foot. 1092 Highland Rd is a home located in Lake County with nearby schools including Mechanics Grove Elementary School, Washington Early Learning Center, and Carl Sandburg Middle School.
Ownership History
Date
Name
Owned For
Owner Type
Purchase Details
Closed on
Jun 29, 2016
Sold by
Wittrock Martin E
Bought by
Wittrock Martin E and Carlson Linda
Current Estimated Value
Home Financials for this Owner
Home Financials are based on the most recent Mortgage that was taken out on this home.
Original Mortgage
$145,000
Outstanding Balance
$64,888
Interest Rate
3.25%
Mortgage Type
New Conventional
Estimated Equity
$239,541
Purchase Details
Closed on
Feb 7, 2009
Sold by
Wittorck Martin and Wittorck Beth
Bought by
Wittrock Martin E
Home Financials for this Owner
Home Financials are based on the most recent Mortgage that was taken out on this home.
Original Mortgage
$160,000
Interest Rate
5.22%
Mortgage Type
New Conventional
Purchase Details
Closed on
Aug 28, 2003
Sold by
Traznik Karen M
Bought by
Wittrock Martin and Wittrock Beth
Home Financials for this Owner
Home Financials are based on the most recent Mortgage that was taken out on this home.
Original Mortgage
$28,200
Interest Rate
5.69%
Mortgage Type
Credit Line Revolving
Create a Home Valuation Report for This Property
The Home Valuation Report is an in-depth analysis detailing your home's value as well as a comparison with similar homes in the area
Home Values in the Area
Average Home Value in this Area
Purchase History
| Date | Buyer | Sale Price | Title Company |
|---|---|---|---|
| Wittrock Martin E | -- | First American Title | |
| Wittrock Martin E | -- | Multiple | |
| Wittrock Martin | $188,000 | -- |
Source: Public Records
Mortgage History
| Date | Status | Borrower | Loan Amount |
|---|---|---|---|
| Open | Wittrock Martin E | $145,000 | |
| Closed | Wittrock Martin E | $160,000 | |
| Closed | Wittrock Martin | $28,200 | |
| Closed | Wittrock Martin | $150,400 |
Source: Public Records
Tax History Compared to Growth
Tax History
| Year | Tax Paid | Tax Assessment Tax Assessment Total Assessment is a certain percentage of the fair market value that is determined by local assessors to be the total taxable value of land and additions on the property. | Land | Improvement |
|---|---|---|---|---|
| 2024 | $6,217 | $73,555 | $18,326 | $55,229 |
| 2023 | $5,260 | $67,395 | $16,791 | $50,604 |
| 2022 | $5,260 | $55,748 | $18,615 | $37,133 |
| 2021 | $5,385 | $57,199 | $19,100 | $38,099 |
| 2020 | $5,290 | $55,624 | $18,574 | $37,050 |
| 2019 | $5,108 | $52,962 | $17,963 | $34,999 |
| 2018 | $5,040 | $52,367 | $17,410 | $34,957 |
| 2017 | $4,971 | $50,719 | $16,862 | $33,857 |
| 2016 | $4,828 | $48,171 | $16,015 | $32,156 |
| 2015 | $4,688 | $45,159 | $15,014 | $30,145 |
| 2014 | $4,690 | $45,867 | $15,021 | $30,846 |
| 2012 | $4,700 | $46,274 | $15,154 | $31,120 |
Source: Public Records
Map
Nearby Homes
- 1152 Aberdeen Ln
- 973 Highland Rd
- 1285 Appleby Cir
- 1021 Wrens Gate
- 728 W Maple Ave
- 851 Glenview Ave
- 1329 Turnberry Ln
- 1304 Dunleer Dr
- 212 Londonderry Ct
- 1300 Kettering Rd
- 547 N Ridgemoor Ave
- 620 Salceda Dr
- 200 Ambria Dr
- 522 W Park St
- 1291 Banbury Rd
- 531 Salceda Ln
- 742 N Lake St
- 360 Ambria Dr
- 137 Racine Place
- 1912 Friars Ln
- 1078 Highland Rd
- 1104 Highland Rd
- 1064 Highland Rd
- 1095 N Midlothian Rd
- 1087 N Midlothian Rd
- 1050 Highland Rd
- 1107 N Midlothian Rd
- 1118 Highland Rd
- 1065 N Midlothian Rd
- 1107 Highland Rd
- 1113 N Midlothian Rd
- 1034 Highland Rd
- 1051 N Midlothian Rd
- 1092 Aberdeen Ln
- 1121 N Midlothian Rd
- 1033 N Midlothian Rd
- 1126 Highland Rd
- 1018 Highland Rd
- 1125 Highland Rd
- 1127 N Midlothian Rd