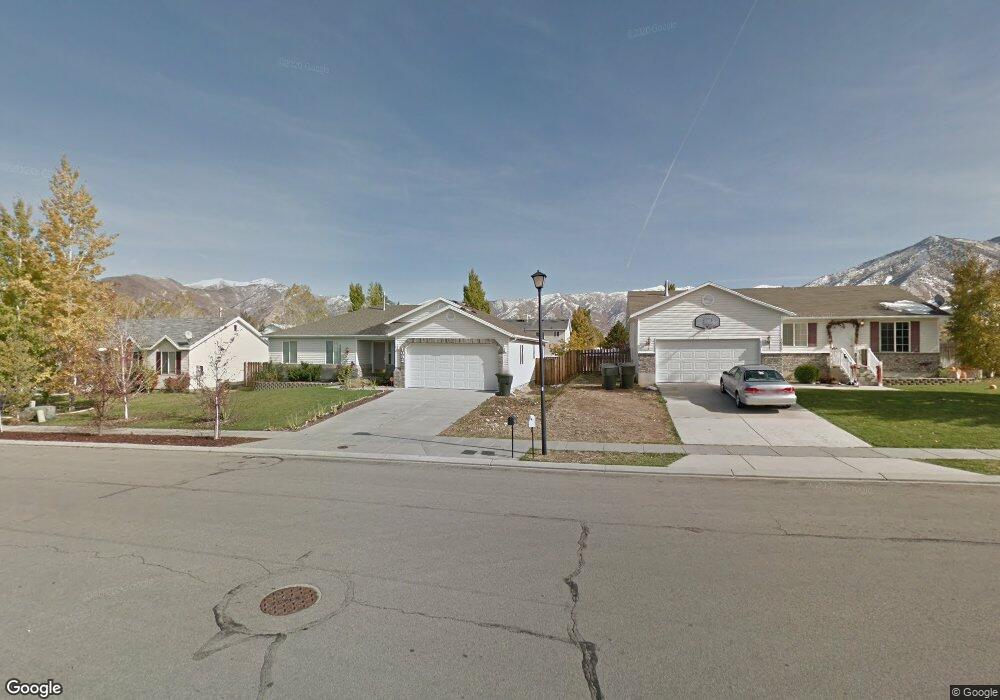
1092 N 490 E Tooele, UT 84074
Estimated Value: $444,000 - $534,000
5
Beds
2
Baths
3,230
Sq Ft
$147/Sq Ft
Est. Value
About This Home
This home is located at 1092 N 490 E, Tooele, UT 84074 and is currently estimated at $475,022, approximately $147 per square foot. 1092 N 490 E is a home located in Tooele County with nearby schools including Copper Canyon Elementary School, Clarke N. Johnsen Junior High School, and Stansbury High School.
Ownership History
Date
Name
Owned For
Owner Type
Purchase Details
Closed on
Sep 7, 2017
Sold by
Oblad Scott C
Bought by
Munquin Joaquin
Current Estimated Value
Home Financials for this Owner
Home Financials are based on the most recent Mortgage that was taken out on this home.
Original Mortgage
$246,944
Outstanding Balance
$207,423
Interest Rate
4.12%
Mortgage Type
FHA
Estimated Equity
$267,599
Purchase Details
Closed on
Aug 15, 2017
Sold by
Oblad Kristin M and Hall Kristin
Bought by
Oblad Scott C
Home Financials for this Owner
Home Financials are based on the most recent Mortgage that was taken out on this home.
Original Mortgage
$246,944
Outstanding Balance
$207,423
Interest Rate
4.12%
Mortgage Type
FHA
Estimated Equity
$267,599
Create a Home Valuation Report for This Property
The Home Valuation Report is an in-depth analysis detailing your home's value as well as a comparison with similar homes in the area
Purchase History
We collect this data history from publicly available records. To have your information removed, we recommend requesting removal directly through your county’s website.
| Date | Buyer | Sale Price | Title Company |
|---|---|---|---|
| Munquin Joaquin | -- | First American Title Insuran | |
| Oblad Scott C | -- | First American Title Insuran |
Source: Public Records
Mortgage History
We collect this data history from publicly available records. To have your information removed, we recommend requesting removal directly through your county’s website.
| Date | Status | Borrower | Loan Amount |
|---|---|---|---|
| Open | Munquin Joaquin | $246,944 |
Source: Public Records
Tax History
| Year | Tax Paid | Tax Assessment Tax Assessment Total Assessment is a certain percentage of the fair market value that is determined by local assessors to be the total taxable value of land and additions on the property. | Land | Improvement |
|---|---|---|---|---|
| 2025 | $3,073 | $465,981 | $102,500 | $363,481 |
| 2024 | $3,363 | $256,663 | $56,375 | $200,288 |
| 2023 | $3,363 | $271,372 | $53,689 | $217,683 |
| 2022 | $3,155 | $271,416 | $53,453 | $217,963 |
| 2021 | $2,627 | $189,045 | $21,381 | $167,664 |
| 2020 | $2,492 | $311,056 | $38,875 | $272,181 |
| 2019 | $2,428 | $298,095 | $38,875 | $259,220 |
| 2018 | $2,230 | $259,678 | $40,000 | $219,678 |
| 2017 | $1,836 | $253,597 | $30,000 | $223,597 |
| 2016 | $1,488 | $123,438 | $16,500 | $106,938 |
| 2015 | $1,488 | $108,230 | $0 | $0 |
| 2014 | -- | $108,230 | $0 | $0 |
Source: Public Records
Map
Nearby Homes
Your Personal Tour Guide
Ask me questions while you tour the home.