Estimated Value: $814,433 - $964,000
4
Beds
2
Baths
2,195
Sq Ft
$403/Sq Ft
Est. Value
About This Home
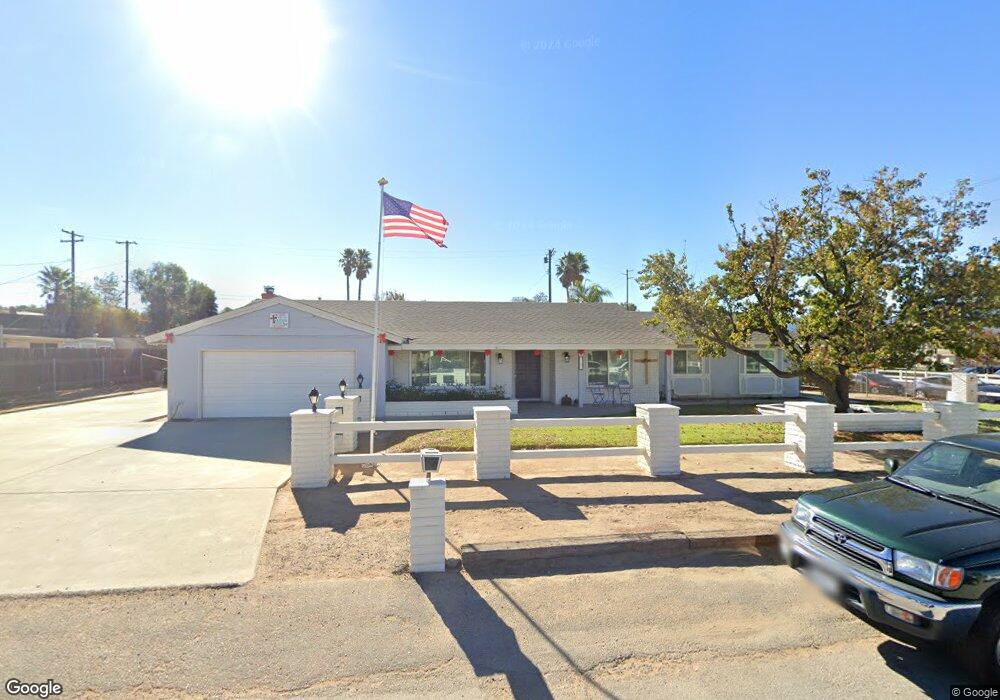
This home is located at 1092 Raquel Rd, Norco, CA 92860 and is currently estimated at $884,608, approximately $403 per square foot. 1092 Raquel Rd is a home located in Riverside County with nearby schools including Norco Elementary, Norco Intermediate School, and Norco High School.
Ownership History
Date
Name
Owned For
Owner Type
Purchase Details
Closed on
Aug 24, 2020
Sold by
Byalick Neil and Byalick Kam Leigh
Bought by
Smith Patrick and Smith Marilyn M
Current Estimated Value
Purchase Details
Closed on
Oct 26, 1999
Sold by
Carole Frankel
Bought by
Byalick Neil and Byalick Kam Leigh
Home Financials for this Owner
Home Financials are based on the most recent Mortgage that was taken out on this home.
Original Mortgage
$125,600
Interest Rate
7.82%
Mortgage Type
Purchase Money Mortgage
Purchase Details
Closed on
Sep 18, 1996
Sold by
Clyde Frankel J
Bought by
Frankel Carole
Home Financials for this Owner
Home Financials are based on the most recent Mortgage that was taken out on this home.
Original Mortgage
$120,250
Interest Rate
10.99%
Mortgage Type
Purchase Money Mortgage
Create a Home Valuation Report for This Property
The Home Valuation Report is an in-depth analysis detailing your home's value as well as a comparison with similar homes in the area
Home Values in the Area
Average Home Value in this Area
Purchase History
| Date | Buyer | Sale Price | Title Company |
|---|---|---|---|
| Smith Patrick | $576,000 | None Available | |
| Byalick Neil | $160,500 | Gateway Title Company | |
| Frankel Carole | -- | United Independent Title Ins |
Source: Public Records
Mortgage History
| Date | Status | Borrower | Loan Amount |
|---|---|---|---|
| Previous Owner | Byalick Neil | $125,600 | |
| Previous Owner | Frankel Carole | $120,250 |
Source: Public Records
Tax History Compared to Growth
Tax History
| Year | Tax Paid | Tax Assessment Tax Assessment Total Assessment is a certain percentage of the fair market value that is determined by local assessors to be the total taxable value of land and additions on the property. | Land | Improvement |
|---|---|---|---|---|
| 2025 | $2,676 | $250,831 | $43,545 | $207,286 |
| 2023 | $2,676 | $241,093 | $41,855 | $199,238 |
| 2022 | $2,588 | $236,367 | $41,035 | $195,332 |
| 2021 | $2,550 | $231,733 | $40,231 | $191,502 |
| 2020 | $3,083 | $281,052 | $98,363 | $182,689 |
| 2019 | $3,010 | $275,542 | $96,435 | $179,107 |
| 2018 | $2,939 | $270,141 | $94,546 | $175,595 |
| 2017 | $2,864 | $264,845 | $92,693 | $172,152 |
| 2016 | $2,834 | $259,653 | $90,876 | $168,777 |
| 2015 | $2,770 | $255,755 | $89,512 | $166,243 |
| 2014 | $2,666 | $250,747 | $87,759 | $162,988 |
Source: Public Records
Map
Nearby Homes
- 1825 Tonto Bar Ln
- 1049 2nd St
- 1390 Corona Ave
- 1454 Hilltop Ln
- 1104 Thoroughbred Ln
- 1211 Thoroughbred Ln
- 1510 Valley View Ave
- 0 1st St Unit IG24252189
- 543 Silverhawk Dr
- 929 Mesa Alta Cir
- 1270 Mancero Cir
- 1461 Goldeneagle Dr
- 909 Heron Dr
- 827 La Cadena Ln
- 1096 Casandra Ln
- 2582 Reservoir Dr
- 918 N Temescal Cir
- 2597 Corona Ave
- 2627 Valley View Ave
- 1041 Lori Ct
- 1701 Temescal Ave
- 1070 Raquel Rd
- 1093 Raquel Rd
- 1675 Temescal Ave
- 1071 Raquel Rd
- 1688 Raquel Rd
- 1050 Raquel Rd
- 1668 Raquel Rd
- 1661 Temescal Ave
- 1049 Raquel Rd
- 1621 Temescal Ave
- 1658 Raquel Rd
- 1025 Raquel Rd
- 1630 Temescal Ave
- 1719 Raquel Rd
- 1693 Raquel Rd
- 1741 Raquel Rd
- 1827 Temescal Ave
- 1820 Temescal Ave
- 1615 Temescal Ave