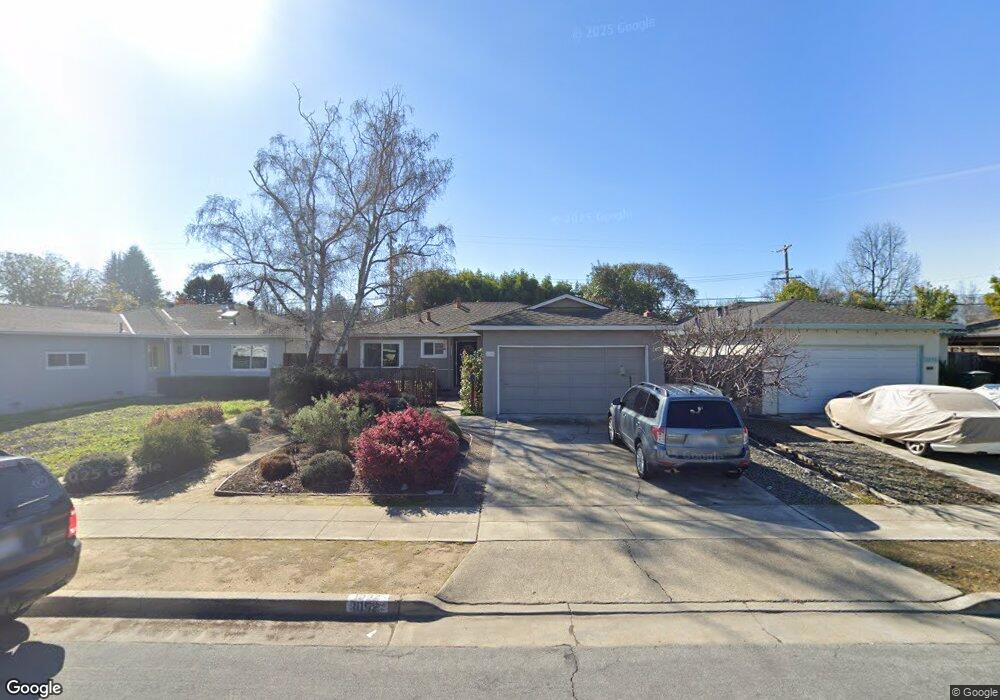
1092 W Mc Kinley Ave Sunnyvale, CA 94086
Estimated Value: $2,095,802 - $2,243,000
3
Beds
2
Baths
1,066
Sq Ft
$2,032/Sq Ft
Est. Value
About This Home
This home is located at 1092 W Mc Kinley Ave, Sunnyvale, CA 94086 and is currently estimated at $2,165,701, approximately $2,031 per square foot. 1092 W Mc Kinley Ave is a home located in Santa Clara County with nearby schools including Vargas Elementary School, Sunnyvale Middle School, and Homestead High School.
Ownership History
Date
Name
Owned For
Owner Type
Purchase Details
Closed on
Nov 12, 2021
Sold by
Kemper Peggy Lynch
Bought by
Kemper Peggy Lynch and Kemper Peggy Lynch
Current Estimated Value
Home Financials for this Owner
Home Financials are based on the most recent Mortgage that was taken out on this home.
Original Mortgage
$495,000
Outstanding Balance
$453,582
Interest Rate
2.99%
Mortgage Type
New Conventional
Estimated Equity
$1,712,119
Purchase Details
Closed on
Apr 10, 2019
Sold by
Kemper Peggy Lynch
Bought by
Lynch Kemper Peggy and Peggy Lynch Kemper Trust
Home Financials for this Owner
Home Financials are based on the most recent Mortgage that was taken out on this home.
Original Mortgage
$100,000
Interest Rate
4.3%
Mortgage Type
Credit Line Revolving
Purchase Details
Closed on
Mar 27, 2019
Sold by
Kemper Peggy Lynch and Peggy Lynch Kemper Trust
Bought by
Lynch Kemper Peggy
Home Financials for this Owner
Home Financials are based on the most recent Mortgage that was taken out on this home.
Original Mortgage
$100,000
Interest Rate
4.3%
Mortgage Type
Credit Line Revolving
Purchase Details
Closed on
Dec 11, 2012
Sold by
Kemper Peggy Lynch
Bought by
Kemper Peggy Lynch
Home Financials for this Owner
Home Financials are based on the most recent Mortgage that was taken out on this home.
Original Mortgage
$400,000
Interest Rate
3.35%
Mortgage Type
New Conventional
Purchase Details
Closed on
Nov 10, 2010
Sold by
Kemper Peggy Lynch
Bought by
Kemper Peggy Lynch
Home Financials for this Owner
Home Financials are based on the most recent Mortgage that was taken out on this home.
Original Mortgage
$376,000
Interest Rate
4.16%
Mortgage Type
New Conventional
Purchase Details
Closed on
Nov 13, 2009
Sold by
Kemper Peggy L
Bought by
Kemper Peggy Lynch
Home Financials for this Owner
Home Financials are based on the most recent Mortgage that was taken out on this home.
Original Mortgage
$371,000
Interest Rate
4.83%
Mortgage Type
New Conventional
Purchase Details
Closed on
Mar 18, 2009
Sold by
Kemper Peggy Lynch
Bought by
Kemper Peggy Lynch
Purchase Details
Closed on
Jun 29, 2000
Sold by
Kemper William Lance
Bought by
Kemper Peggy Lynch
Home Financials for this Owner
Home Financials are based on the most recent Mortgage that was taken out on this home.
Original Mortgage
$20,000
Interest Rate
8%
Mortgage Type
Stand Alone Second
Purchase Details
Closed on
Jun 9, 1998
Sold by
Sullivan Daniel M
Bought by
Sullivan Peggy Lynch
Create a Home Valuation Report for This Property
The Home Valuation Report is an in-depth analysis detailing your home's value as well as a comparison with similar homes in the area
Home Values in the Area
Average Home Value in this Area
Purchase History
| Date | Buyer | Sale Price | Title Company |
|---|---|---|---|
| Kemper Peggy Lynch | -- | Old Republic Title Company | |
| Lynch Kemper Peggy | -- | Chicago Title | |
| Lynch Kemper Peggy | -- | Chicago Title | |
| Kemper Peggy Lynch | -- | Accommodation | |
| Kemper Peggy Lynch | -- | Chicago Title Company | |
| Kemper Peggy Lynch | -- | Accommodation | |
| Kemper Peggy Lynch | -- | Chicago Title Company | |
| Kemper Peggy Lynch | -- | Accommodation | |
| Kemper Peggy L | -- | Chicago Title Company | |
| Kemper Peggy Lynch | -- | None Available | |
| Kemper Peggy Lynch | -- | Old Republic Title Company | |
| Sullivan Peggy Lynch | -- | -- |
Source: Public Records
Mortgage History
| Date | Status | Borrower | Loan Amount |
|---|---|---|---|
| Open | Kemper Peggy Lynch | $495,000 | |
| Closed | Lynch Kemper Peggy | $100,000 | |
| Closed | Kemper Peggy Lynch | $400,000 | |
| Closed | Kemper Peggy Lynch | $376,000 | |
| Closed | Kemper Peggy L | $371,000 | |
| Closed | Kemper Peggy Lynch | $20,000 |
Source: Public Records
Tax History Compared to Growth
Tax History
| Year | Tax Paid | Tax Assessment Tax Assessment Total Assessment is a certain percentage of the fair market value that is determined by local assessors to be the total taxable value of land and additions on the property. | Land | Improvement |
|---|---|---|---|---|
| 2025 | $3,014 | $243,091 | $103,576 | $139,515 |
| 2024 | $3,014 | $238,326 | $101,546 | $136,780 |
| 2023 | $2,987 | $233,654 | $99,555 | $134,099 |
| 2022 | $2,946 | $229,073 | $97,603 | $131,470 |
| 2021 | $2,918 | $224,583 | $95,690 | $128,893 |
| 2020 | $2,882 | $222,281 | $94,709 | $127,572 |
| 2019 | $2,741 | $217,923 | $92,852 | $125,071 |
| 2018 | $2,687 | $213,651 | $91,032 | $122,619 |
| 2017 | $2,652 | $209,463 | $89,248 | $120,215 |
| 2016 | $2,545 | $205,357 | $87,499 | $117,858 |
| 2015 | $2,556 | $202,273 | $86,185 | $116,088 |
| 2014 | $2,508 | $198,311 | $84,497 | $113,814 |
Source: Public Records
Map
Nearby Homes
- 1127 Viscaino Ave
- 373 Redondo Terrace
- 991 Asilomar Terrace Unit 1
- 987 Asilomar Terrace Unit 2
- 434 Purisima Ave
- 984 Belmont Terrace Unit 10
- 971 Belmont Terrace Unit 9
- 1033 Crestview Dr Unit 308
- 433 Sylvan Ave
- 433 Sylvan Ave Unit 113
- 433 Sylvan Ave Unit 84
- 926 La Mesa Terrace Unit E
- 325 Sylvan Ave Unit 47
- 325 Sylvan Ave
- 1021 Golf Ct
- 1201 Heatherstone Way
- 857 Peach Ave
- 745 Reseda Dr
- 960 Heatherstone Ave
- 541 Holthouse Terrace
- 1088 W Mc Kinley Ave
- 1096 W Mc Kinley Ave
- 1084 W Mc Kinley Ave
- 302 Leota Ave
- 1089 Polk Ave
- 1095 Polk Ave
- 1085 Polk Ave
- 304 Leota Ave
- 1077 Polk Ave
- 1076 W Mc Kinley Ave
- 1089 W Mc Kinley Ave
- 1089 W Mckinley Ave
- 1095 W Mc Kinley Ave
- 1085 W Mc Kinley Ave
- 1073 Polk Ave
- 298 Leota Ave
- 1077 W Mc Kinley Ave
- 1072 W Mc Kinley Ave
- 303 Leota Ave
- 1069 Polk Ave