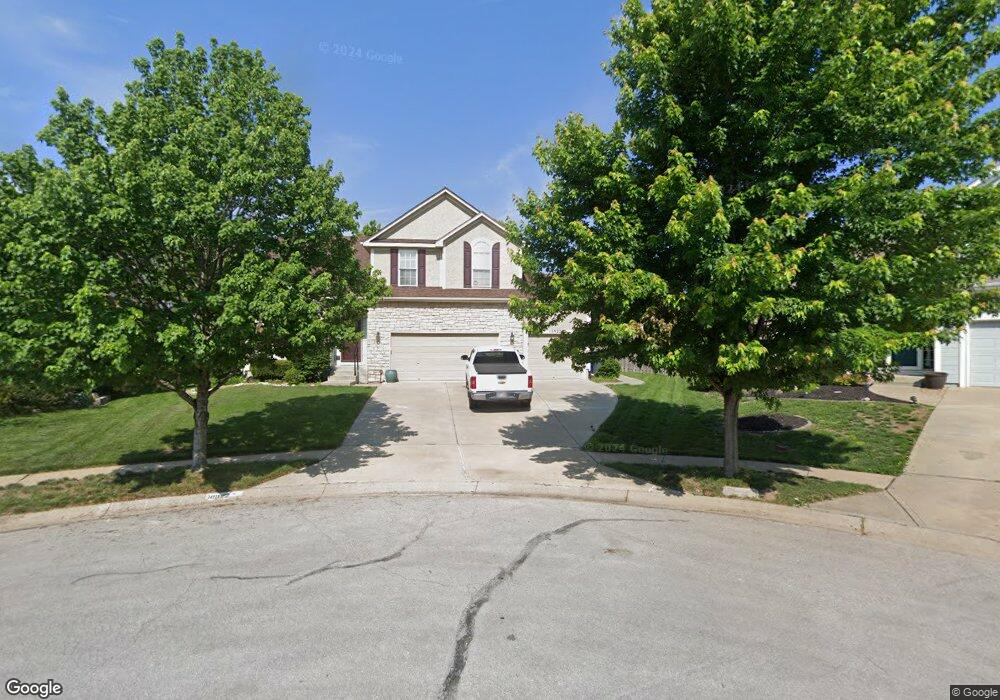
10922 S Emerald St Olathe, KS 66061
Estimated Value: $448,864 - $491,000
4
Beds
3
Baths
1,530
Sq Ft
$304/Sq Ft
Est. Value
About This Home
This home is located at 10922 S Emerald St, Olathe, KS 66061 and is currently estimated at $465,716, approximately $304 per square foot. 10922 S Emerald St is a home located in Johnson County with nearby schools including Meadow Lane Elementary School, Prairie Trail Middle School, and Olathe Northwest High School.
Ownership History
Date
Name
Owned For
Owner Type
Purchase Details
Closed on
Sep 8, 2010
Sold by
Cummins Samuel J and Cummins Anna L
Bought by
Davis Brian L and Hartzler Diana L
Current Estimated Value
Home Financials for this Owner
Home Financials are based on the most recent Mortgage that was taken out on this home.
Original Mortgage
$236,760
Outstanding Balance
$156,816
Interest Rate
4.5%
Mortgage Type
FHA
Estimated Equity
$308,900
Purchase Details
Closed on
Sep 21, 2005
Sold by
Fallbrook Building Llc
Bought by
Cummins Samuel J and Cummins Anna L
Home Financials for this Owner
Home Financials are based on the most recent Mortgage that was taken out on this home.
Original Mortgage
$37,422
Interest Rate
5.76%
Mortgage Type
Credit Line Revolving
Create a Home Valuation Report for This Property
The Home Valuation Report is an in-depth analysis detailing your home's value as well as a comparison with similar homes in the area
Home Values in the Area
Average Home Value in this Area
Purchase History
| Date | Buyer | Sale Price | Title Company |
|---|---|---|---|
| Davis Brian L | -- | First American Title Ins Co | |
| Cummins Samuel J | -- | Midwest Title Co Inc | |
| Fallbrook Building Llc | -- | Midwest Tite Company Inc |
Source: Public Records
Mortgage History
| Date | Status | Borrower | Loan Amount |
|---|---|---|---|
| Open | Davis Brian L | $236,760 | |
| Previous Owner | Fallbrook Building Llc | $37,422 | |
| Previous Owner | Fallbrook Building Llc | $199,584 |
Source: Public Records
Tax History Compared to Growth
Tax History
| Year | Tax Paid | Tax Assessment Tax Assessment Total Assessment is a certain percentage of the fair market value that is determined by local assessors to be the total taxable value of land and additions on the property. | Land | Improvement |
|---|---|---|---|---|
| 2024 | $5,086 | $45,161 | $11,175 | $33,986 |
| 2023 | $4,959 | $43,206 | $9,712 | $33,494 |
| 2022 | $4,496 | $38,134 | $8,448 | $29,686 |
| 2021 | $4,241 | $34,293 | $7,675 | $26,618 |
| 2020 | $4,450 | $35,638 | $7,675 | $27,963 |
| 2019 | $4,396 | $34,972 | $7,681 | $27,291 |
| 2018 | $3,913 | $33,500 | $7,681 | $25,819 |
| 2017 | $4,159 | $32,522 | $6,979 | $25,543 |
| 2016 | $3,671 | $29,463 | $6,065 | $23,398 |
| 2015 | $3,587 | $28,807 | $6,065 | $22,742 |
| 2013 | -- | $26,623 | $5,809 | $20,814 |
Source: Public Records
Map
Nearby Homes
- Westwood Plan at Cedar Ridge Reserve - Cedar Ridge
- Truman Plan at Cedar Ridge Reserve - Cedar Ridge
- Roosevelt Ex Plan at Cedar Ridge Reserve - Cedar Ridge
- Roosevelt SE Plan at Cedar Ridge Reserve - Cedar Ridge
- Roosevelt Plan at Cedar Ridge Reserve - Cedar Ridge
- Roosevelt Ranch SE Plan at Cedar Ridge Reserve - Cedar Ridge
- Riviera Plan at Cedar Ridge Reserve - Cedar Ridge
- Oakmont Plan at Cedar Ridge Reserve - Cedar Ridge
- Madison II Plan at Cedar Ridge Reserve - Cedar Ridge
- Kingston Plan at Cedar Ridge Reserve - Cedar Ridge
- Jefferson IV Plan at Cedar Ridge Reserve - Cedar Ridge
- Jefferson III Plan at Cedar Ridge Reserve - Cedar Ridge
- Jefferson II Plan at Cedar Ridge Reserve - Cedar Ridge
- Jefferson Ex Plan at Cedar Ridge Reserve - Cedar Ridge
- Jefferson 4 Car Plan at Cedar Ridge Reserve - Cedar Ridge
- Jefferson 1.5 EX Plan at Cedar Ridge Reserve - Cedar Ridge
- Jackson II Plan at Cedar Ridge Reserve - Cedar Ridge
- Harbor Plan at Cedar Ridge Reserve - Cedar Ridge
- Hamilton SE Plan at Cedar Ridge Reserve - Cedar Ridge
- Hamilton 3 Car SE Plan at Cedar Ridge Reserve - Cedar Ridge
- 10932 S Emerald St
- 10942 S Emerald St
- 10911 S Emerald St
- 10952 S Emerald St
- 10931 S Emerald St
- 10921 S Emerald St
- 10941 S Emerald St
- 10962 S Emerald St
- 10951 S Emerald St
- 10928 S Langley St
- 10961 S Emerald St
- 10938 S Langley St
- 10972 S Emerald St
- 10948 S Langley St
- 10918 S Langley St
- 10940 S Woodland St
- 10891 S Harwick St
- 10968 S Langley St
- 10982 S Emerald St
- 10981 S Emerald St