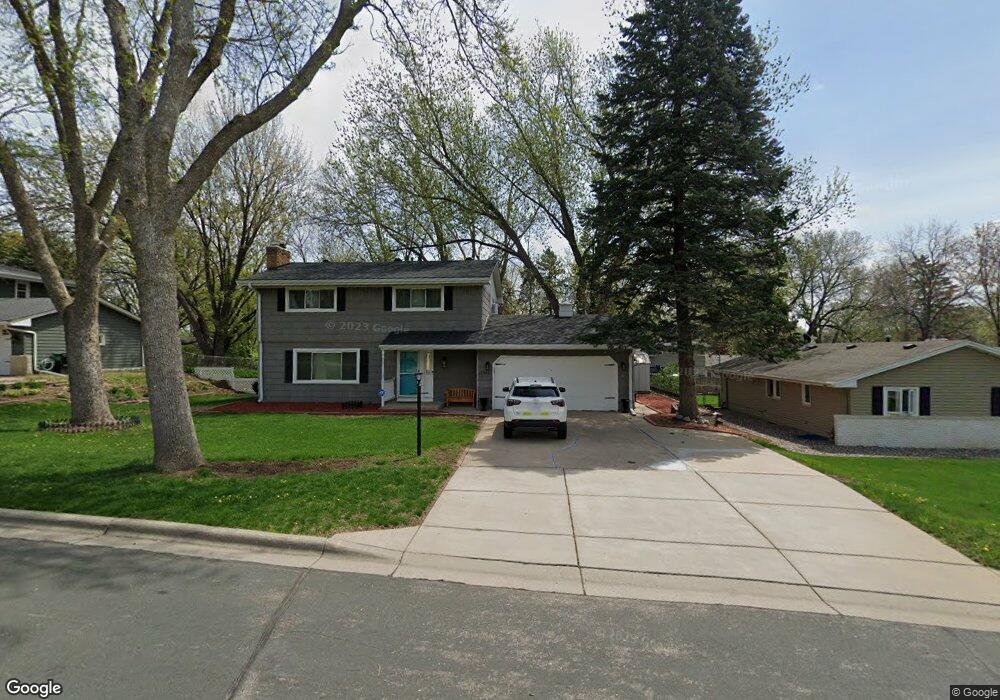
10923 Pioneer Dr Burnsville, MN 55337
Estimated Value: $403,000 - $426,000
4
Beds
3
Baths
2,126
Sq Ft
$193/Sq Ft
Est. Value
About This Home
This home is located at 10923 Pioneer Dr, Burnsville, MN 55337 and is currently estimated at $410,483, approximately $193 per square foot. 10923 Pioneer Dr is a home located in Dakota County with nearby schools including Burnsville High School, Gateway STEM Academy, and Sunrise International Montessori School.
Ownership History
Date
Name
Owned For
Owner Type
Purchase Details
Closed on
Jun 28, 2021
Sold by
Seibert Jacob and Seibert Paige
Bought by
Ally Asif and Ally Felicia
Current Estimated Value
Home Financials for this Owner
Home Financials are based on the most recent Mortgage that was taken out on this home.
Original Mortgage
$371,510
Outstanding Balance
$337,088
Interest Rate
2.9%
Mortgage Type
New Conventional
Estimated Equity
$73,395
Purchase Details
Closed on
Jul 19, 2019
Sold by
Flynn Patrick J and Flynn Marlene K
Bought by
Seibert Jacob and Seibert Paige
Home Financials for this Owner
Home Financials are based on the most recent Mortgage that was taken out on this home.
Original Mortgage
$274,550
Interest Rate
3.8%
Mortgage Type
New Conventional
Purchase Details
Closed on
Dec 31, 1998
Sold by
Louiselle David J and Louiselle Peggy A
Bought by
Flynn Patrick J and Flynn Marlene R
Purchase Details
Closed on
Sep 26, 1997
Sold by
Woldur Grant H and Woldur Karen P
Bought by
Louiselle Daniel J and Louiselle Peggy A
Create a Home Valuation Report for This Property
The Home Valuation Report is an in-depth analysis detailing your home's value as well as a comparison with similar homes in the area
Home Values in the Area
Average Home Value in this Area
Purchase History
| Date | Buyer | Sale Price | Title Company |
|---|---|---|---|
| Ally Asif | $383,000 | Edina Realty Title Inc | |
| Seibert Jacob | $289,000 | Burnet Title | |
| Flynn Patrick J | $148,000 | -- | |
| Louiselle Daniel J | $133,000 | -- | |
| Ally Asif Asif | $383,000 | -- |
Source: Public Records
Mortgage History
| Date | Status | Borrower | Loan Amount |
|---|---|---|---|
| Open | Ally Asif | $371,510 | |
| Previous Owner | Seibert Jacob | $274,550 | |
| Closed | Ally Asif Asif | $371,510 |
Source: Public Records
Tax History Compared to Growth
Tax History
| Year | Tax Paid | Tax Assessment Tax Assessment Total Assessment is a certain percentage of the fair market value that is determined by local assessors to be the total taxable value of land and additions on the property. | Land | Improvement |
|---|---|---|---|---|
| 2024 | $3,422 | $327,800 | $90,100 | $237,700 |
| 2023 | $3,422 | $331,000 | $90,200 | $240,800 |
| 2022 | $2,858 | $322,700 | $90,000 | $232,700 |
| 2021 | $2,830 | $275,600 | $78,200 | $197,400 |
| 2020 | $2,798 | $260,100 | $71,400 | $188,700 |
| 2019 | $2,836 | $248,800 | $68,000 | $180,800 |
| 2018 | $2,856 | $227,100 | $64,800 | $162,300 |
| 2017 | $2,726 | $221,800 | $61,700 | $160,100 |
| 2016 | $2,790 | $208,700 | $58,800 | $149,900 |
| 2015 | $2,668 | $186,319 | $51,781 | $134,538 |
| 2014 | -- | $184,575 | $50,792 | $133,783 |
| 2013 | -- | $163,429 | $45,540 | $117,889 |
Source: Public Records
Map
Nearby Homes
- 10934 Southview Dr
- 3108 Foxpoint Cir
- 11017 27th Ave S
- 11036 27th Ave S
- 4165 Old Sibley Hwy
- 3113 Chandler Ct
- 11115 Carver Ct
- 11459 Galtier Dr
- 2329 Explorer Ct
- 2177 Cool Stream Cir
- 4413 Slater Rd
- 4425 Cinnamon Ridge Cir
- 4427 Cinnamon Ridge Cir
- 2001 Woods Ln
- 4463 Cinnamon Ridge Cir
- 3017 Mcleod St
- 4370 Nicols Rd
- 11311 W River Hills Dr
- 2081 Copper Ln
- 1601 Raleigh Dr
- 10919 Pioneer Dr
- 10927 Pioneer Dr
- 10922 Southview Dr
- 10918 Southview Dr
- 10926 Southview Dr
- 10915 Pioneer Dr
- 10931 Pioneer Dr
- 10936 Pioneer Dr
- 10932 Pioneer Dr
- 10914 Southview Dr
- 10930 Southview Dr
- 10940 Pioneer Dr
- 10928 Pioneer Dr
- 2800 River Hills Dr
- 10911 Pioneer Dr
- 10944 Pioneer Dr
- 10910 Southview Dr
- 10924 Pioneer Dr
- 10905 Ridgewood Ct
- 10929 Southview Dr