NOT LISTED FOR SALE

Estimated Value: $373,973 - $432,000

3 Beds
3 Baths
1,574 Sq Ft
$262/Sq Ft Est. Value

Last Sold June 27, 2018

Last sale price $250,111 $159 Per Sq Ft

Est. 65% increase in value since last sale

Current estimated payment $2,585/month

About This Home

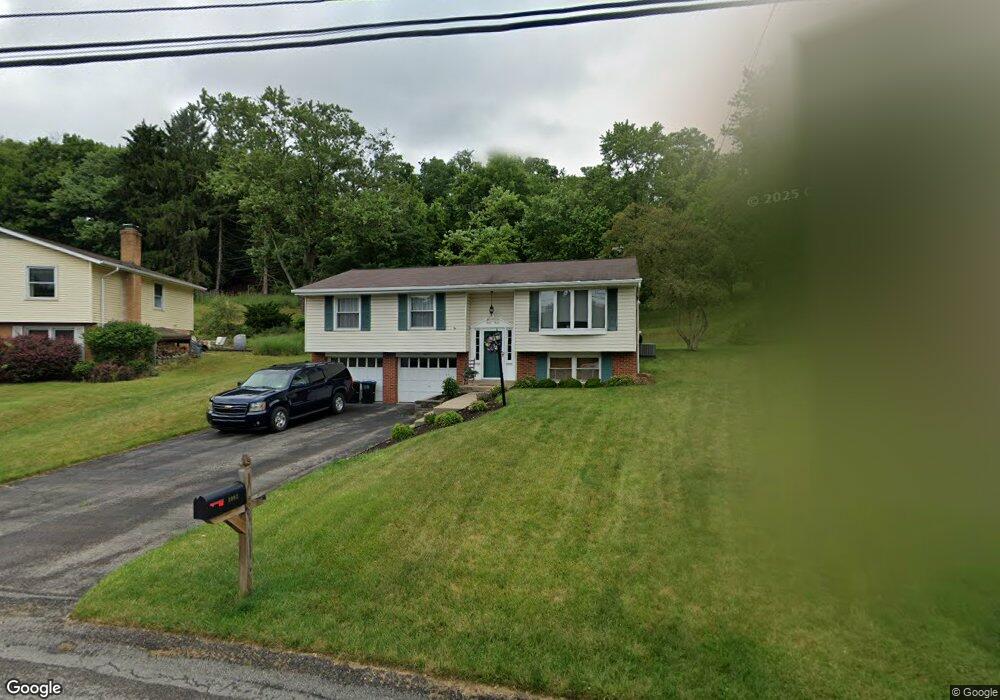
Welcome Home to 1093 Balmoral Drive in the heart of the North Hills and the coveted North Allegheny School District. As you drive through the neighborhood to the home, you will first notice a lot of green as everyone in the community seems to take well care of their yards. This home has 3 bedrooms and 3 full bathrooms with an inviting open feel throughout. Although the floors have wall to wall carpet, there are hardwood ones hidden underneath. The covered patio and HUGE yard are great for entertaining a weekend barbecue and the lower level game room is perfect for the big game or that extra space to simply get away from everyone else. This home comes with a one year home warranty.

Ownership History

Date Name Owned For Owner Type

Purchase Details

Listed on
May 15, 2018
Closed on
Jun 27, 2018
Sold by
Flack Ronald E
Bought by
Vanland Clinton and Vanland Van Land
Seller's Agent
Dave Tumpa
BERKSHIRE HATHAWAY THE PREFERRED REALTY
Buyer's Agent
Paula Hinston
RE/MAX SELECT REALTY
List Price
$225,000
Sold Price
$250,111
Premium/Discount to List
$25,111
11.16%
Current Estimated Value
$411,743

Home Financials for this Owner

Home Financials are based on the most recent Mortgage that was taken out on this home.
Estimated Appreciation
$161,632
Avg. Annual Appreciation
7.03%

Purchase Details

Closed on
Oct 17, 1997
Sold by
Taormina Charles A and Taormina Carol Jean
Bought by
Flack Ronald E and Flack Susan
Source: Public Records

Range of Values:

Collateral Analytics

Collateral Analytics Collateral Analytics AVMs (Automated Valuation Model) employ a number of statistical approaches combined with neighborhood-specific comparable selection guarantees the most up-to-date and precise valuations.

Not Available

Collateral Analytics does not have data for the current month. Please view the chart for historical values.

ICE

ICE Mortgage Technology ICE Mortgage Technology’s AVM (Automated Valuation Model) is a state-of-the-art online residential property valuation tool that provides a quick and accurate estimate of the value of almost any home in the U.S.

Not Available

ICE Mortgage Technology does not have data for the current month. Please view the chart for historical values.

First American

First American First American Data & Analytics’ next-generation AVM combines unrivaled data assets with a blended ensemble of valuation models to produce highly accurate, reliable valuations you can trust.

Not Available

First American does not have data for the current month. Please view the chart for historical values.

Quantarium

Quantarium Quantarium’s valuation service, repeatedly proven the industry’s most accurate and comprehensive, is supercharged with a self-learning and auto-tuning AI engine that continually becomes smarter and more accurate as it processes daily inputs from the industry’s leading RE data lake.

Not Available

Quantarium does not have data for the current month. Please view the chart for historical values.

Average Value
Not Available
List Price
Sold Price
Create a Home Valuation Report for This Property
The Home Valuation Report is an in-depth analysis detailing your home's value as well as a comparison with similar homes in the area

Home Values in the Area

Source: Public Records

Average Home Value in this Area


Source: Public Records

Purchase History

Date Buyer Sale Price Title Company
Vanland Clinton $250,111 Keymax Settlement Svcs Llc
Flack Ronald E $91,250 --
Source: Public Records

Property History

Date Event Price List to Sale Price per Sq Ft Prior Sale
06/27/2018 06/27/18 Sold $250,111 +11.2% $158 / Sq Ft View Prior Sale
05/15/2018 05/15/18 For Sale $225,000 -- $143 / Sq Ft

Tax History Compared to Growth

Source: Public Records

Tax History

Year Tax Paid Tax Assessment Tax Assessment Total Assessment is a certain percentage of the fair market value that is determined by local assessors to be the total taxable value of land and additions on the property. Land Improvement
2025 $5,154 $200,500 $43,500 $157,000
2024 $5,154 $200,500 $43,500 $157,000
2023 $5,154 $200,500 $43,500 $157,000
2022 $5,034 $200,500 $43,500 $157,000
2021 $5,279 $200,500 $43,500 $157,000
2020 $5,034 $200,500 $43,500 $157,000
2019 $3,260 $200,500 $43,500 $157,000
2018 $442 $133,500 $43,500 $90,000
2017 $3,200 $133,500 $43,500 $90,000
2016 $631 $133,500 $43,500 $90,000
2015 $631 $133,500 $43,500 $90,000
2014 $3,128 $133,500 $43,500 $90,000
Source: Public Records

Agents Affiliated with this Home

  • Section Image
  • Section Image
See All Agents

Map