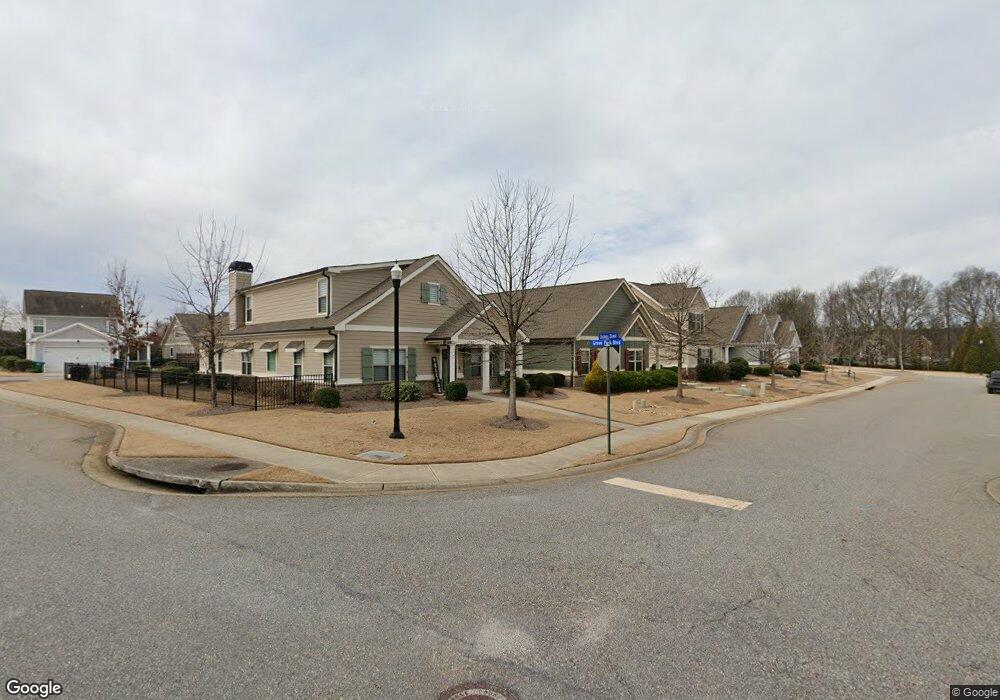
1093 Chalmers St Unit 11 Watkinsville, GA 30677
Estimated Value: $456,023 - $533,000
3
Beds
2
Baths
1,859
Sq Ft
$264/Sq Ft
Est. Value
About This Home
This home is located at 1093 Chalmers St Unit 11, Watkinsville, GA 30677 and is currently estimated at $490,256, approximately $263 per square foot. 1093 Chalmers St Unit 11 is a home located in Oconee County with nearby schools including Oconee County Elementary School, Oconee County Primary School, and Oconee County Middle School.
Ownership History
Date
Name
Owned For
Owner Type
Purchase Details
Closed on
May 12, 2023
Sold by
Brooks Kathleen Z
Bought by
Zelenka Brooks Kathleen Rene and Kathleen Brooks Rev Liv Trust
Current Estimated Value
Purchase Details
Closed on
Oct 3, 2022
Sold by
Trotter Clifford Ray
Bought by
Brooks Kathleen Z
Home Financials for this Owner
Home Financials are based on the most recent Mortgage that was taken out on this home.
Original Mortgage
$155,000
Interest Rate
5.66%
Mortgage Type
New Conventional
Purchase Details
Closed on
Mar 27, 2020
Sold by
Jackson James M
Bought by
Trotter Clifford Ray and Trotter Leah Kristine
Home Financials for this Owner
Home Financials are based on the most recent Mortgage that was taken out on this home.
Original Mortgage
$299,475
Interest Rate
3.62%
Mortgage Type
FHA
Purchase Details
Closed on
Mar 1, 2018
Sold by
Athens Construction Grp Ll
Bought by
Jackson James M and Jackson Donna M
Create a Home Valuation Report for This Property
The Home Valuation Report is an in-depth analysis detailing your home's value as well as a comparison with similar homes in the area
Home Values in the Area
Average Home Value in this Area
Purchase History
| Date | Buyer | Sale Price | Title Company |
|---|---|---|---|
| Zelenka Brooks Kathleen Rene | -- | -- | |
| Brooks Kathleen Z | $405,000 | -- | |
| Trotter Clifford Ray | $305,000 | -- | |
| Jackson James M | $253,900 | -- |
Source: Public Records
Mortgage History
| Date | Status | Borrower | Loan Amount |
|---|---|---|---|
| Previous Owner | Brooks Kathleen Z | $155,000 | |
| Previous Owner | Trotter Clifford Ray | $299,475 |
Source: Public Records
Tax History Compared to Growth
Tax History
| Year | Tax Paid | Tax Assessment Tax Assessment Total Assessment is a certain percentage of the fair market value that is determined by local assessors to be the total taxable value of land and additions on the property. | Land | Improvement |
|---|---|---|---|---|
| 2024 | $23 | $168,119 | $24,000 | $144,119 |
| 2023 | $23 | $153,401 | $18,000 | $135,401 |
| 2022 | $2,860 | $133,309 | $18,000 | $115,309 |
| 2021 | $2,782 | $120,171 | $18,000 | $102,171 |
| 2020 | $26 | $113,121 | $18,000 | $95,121 |
| 2019 | $2,611 | $110,222 | $18,000 | $92,222 |
| 2018 | $1,136 | $47,970 | $18,000 | $29,970 |
| 2017 | $294 | $12,420 | $12,420 | $0 |
| 2016 | $247 | $10,440 | $10,440 | $0 |
Source: Public Records
Map
Nearby Homes
- 1350 Burr Harris Rd
- 1322 Burr Harris Rd
- 2261 Willow Creek Dr
- 1360 Longleaf Ct
- 4280 Willow Creek Dr
- 4220 Willow Creek Dr
- Everett with Crawl Space Plan at Willow Creek
- Fairmont with Crawl Space Plan at Willow Creek
- Bristol with Basement Plan at Willow Creek
- Everett with Basement Plan at Willow Creek
- Fairmont with Basement Plan at Willow Creek
- Bristol with Crawl Space Plan at Willow Creek
- 2091 Sycamore Cir
- 1105 Cold Tree Ln
- 1311 Crabapple Cir
- 1015 Turtle Pond Dr
- 1805 Stonewood Field Rd
- 1295 Stonewood Field Rd
- 1093 Chalmers St
- 1141 Chalmers St Unit 10
- 1141 Chalmers St
- 1047 Chalmers St Unit 12
- 1047 Chalmers St
- 1189 Chalmers St
- 1245 Chalmers St Unit 8
- 1245 Chalmers St
- 1150 Market St
- 1150 Market St Unit 3
- 1102 Market St
- 1200 Market St
- 1054 Market St
- 1054 Market St Unit 27
- 1054 Market St
- 1110 Chalmers St Unit 14
- 1110 Chalmers St
- 1060 Chalmers St Unit 13
- 1060 Chalmers St
- 1158 Chalmers St Unit 15