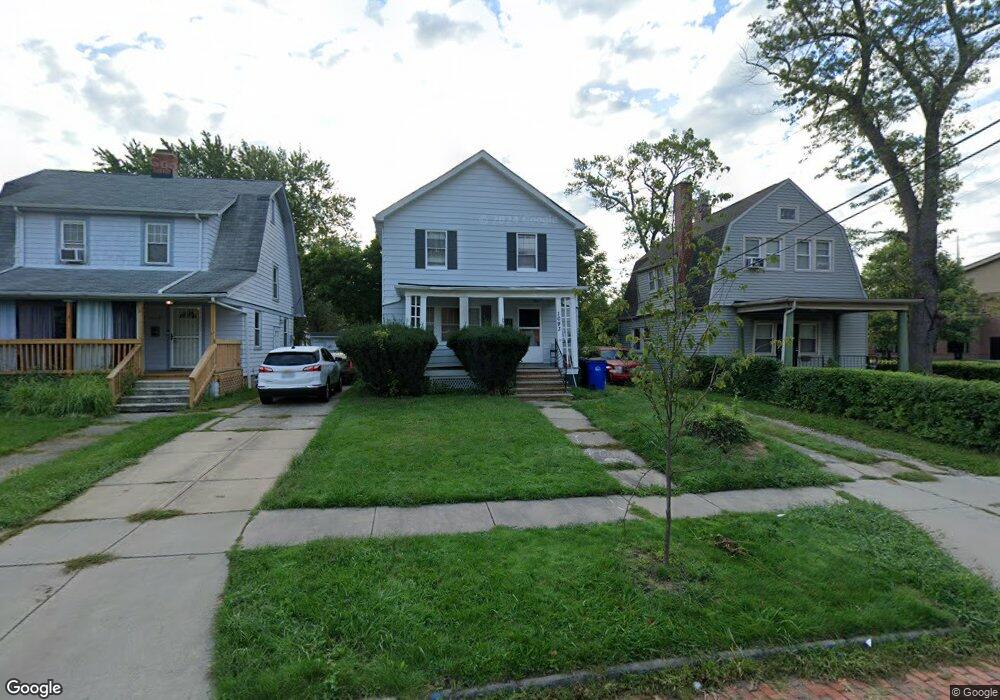
1093 E 176th St Cleveland, OH 44119
North Collinwood NeighborhoodEstimated Value: $87,000 - $103,000
3
Beds
1
Bath
1,104
Sq Ft
$85/Sq Ft
Est. Value
About This Home
This home is located at 1093 E 176th St, Cleveland, OH 44119 and is currently estimated at $93,889, approximately $85 per square foot. 1093 E 176th St is a home located in Cuyahoga County with nearby schools including Bolton, Andrew J. Rickoff School, and Adlai Stevenson School.
Ownership History
Date
Name
Owned For
Owner Type
Purchase Details
Closed on
Jul 10, 2019
Sold by
Key Sohashah
Bought by
Alpha Star Key Llc
Current Estimated Value
Purchase Details
Closed on
Oct 6, 2015
Sold by
Benson Johnnie
Bought by
Key Sahashah
Purchase Details
Closed on
Sep 29, 2015
Sold by
Halon Llc
Bought by
Benson Johnnie
Purchase Details
Closed on
Jan 8, 2015
Sold by
Peldich Mijo Z
Bought by
Halon Llc
Purchase Details
Closed on
Nov 18, 2005
Sold by
Sestan Novica
Bought by
Peldich Mijo Z
Purchase Details
Closed on
Dec 23, 2003
Sold by
Stebner William P
Bought by
Sestan Novica and Peldich Mijo
Home Financials for this Owner
Home Financials are based on the most recent Mortgage that was taken out on this home.
Original Mortgage
$70,000
Interest Rate
5.94%
Mortgage Type
Purchase Money Mortgage
Purchase Details
Closed on
Dec 3, 1991
Sold by
Stebner Emma
Bought by
Stebner Emma
Purchase Details
Closed on
Jan 1, 1975
Bought by
Stebner Emma
Create a Home Valuation Report for This Property
The Home Valuation Report is an in-depth analysis detailing your home's value as well as a comparison with similar homes in the area
Home Values in the Area
Average Home Value in this Area
Purchase History
| Date | Buyer | Sale Price | Title Company |
|---|---|---|---|
| Alpha Star Key Llc | -- | None Available | |
| Key Sahashah | $9,000 | Mount Morris Title Agency | |
| Benson Johnnie | $5,000 | Attorney | |
| Halon Llc | $24,426 | None Available | |
| Peldich Mijo Z | $37,200 | Attorney | |
| Sestan Novica | $44,500 | Executive Title Agency Corp | |
| Stebner Emma | -- | -- | |
| Stebner Emma | -- | -- |
Source: Public Records
Mortgage History
| Date | Status | Borrower | Loan Amount |
|---|---|---|---|
| Previous Owner | Sestan Novica | $70,000 |
Source: Public Records
Tax History Compared to Growth
Tax History
| Year | Tax Paid | Tax Assessment Tax Assessment Total Assessment is a certain percentage of the fair market value that is determined by local assessors to be the total taxable value of land and additions on the property. | Land | Improvement |
|---|---|---|---|---|
| 2024 | $1,563 | $23,380 | $5,880 | $17,500 |
| 2023 | $1,365 | $17,605 | $4,165 | $13,440 |
| 2022 | $1,358 | $17,610 | $4,170 | $13,440 |
| 2021 | $1,345 | $17,610 | $4,170 | $13,440 |
| 2020 | $1,364 | $15,440 | $3,640 | $11,800 |
| 2019 | $1,263 | $44,100 | $10,400 | $33,700 |
| 2018 | $630 | $15,440 | $3,640 | $11,800 |
| 2017 | $1,311 | $15,510 | $3,470 | $12,040 |
| 2016 | $1,697 | $15,510 | $3,470 | $12,040 |
| 2015 | $15,917 | $15,510 | $3,470 | $12,040 |
| 2014 | $15,917 | $17,820 | $3,990 | $13,830 |
Source: Public Records
Map
Nearby Homes
- 1068 E 177th St
- 1113 E 177th St
- 1040 E 177th St
- 1166 E 176th St
- 17702 Nottingham Rd
- 17817 Grovewood Ave
- 17216 Grovewood Ave
- 983 E 179th St
- 1230 E 173rd St
- 17639 Wildwood Ln Unit 17639
- 17633 Wildwood Ln Unit 311
- 1080 E 167th St
- 17610 Wildwood Ln Unit 315
- 18024 Marcella Rd
- 1268 E 169th St
- 1261 E 167th St
- 18111 Marcella Rd
- 17607 Brazil Rd
- 17705 Lake Shore Blvd
- 18404 Neff Rd
- 1097 E 176th St
- 1089 E 176th St
- 1085 E 176th St
- 1081 E 176th St
- 1092 E 177th St
- 1096 E 177th St
- 1088 E 177th St
- 1084 E 177th St
- 1077 E 176th St
- 1080 E 177th St
- 1092 E 176th St
- 1102 E 176th St
- 1073 E 176th St
- 1088 E 176th St
- 1076 E 177th St
- 1104 E 176th St
- 1082 E 176th St
- 1110 E 176th St
- 1069 E 176th St
- 1072 E 177th St