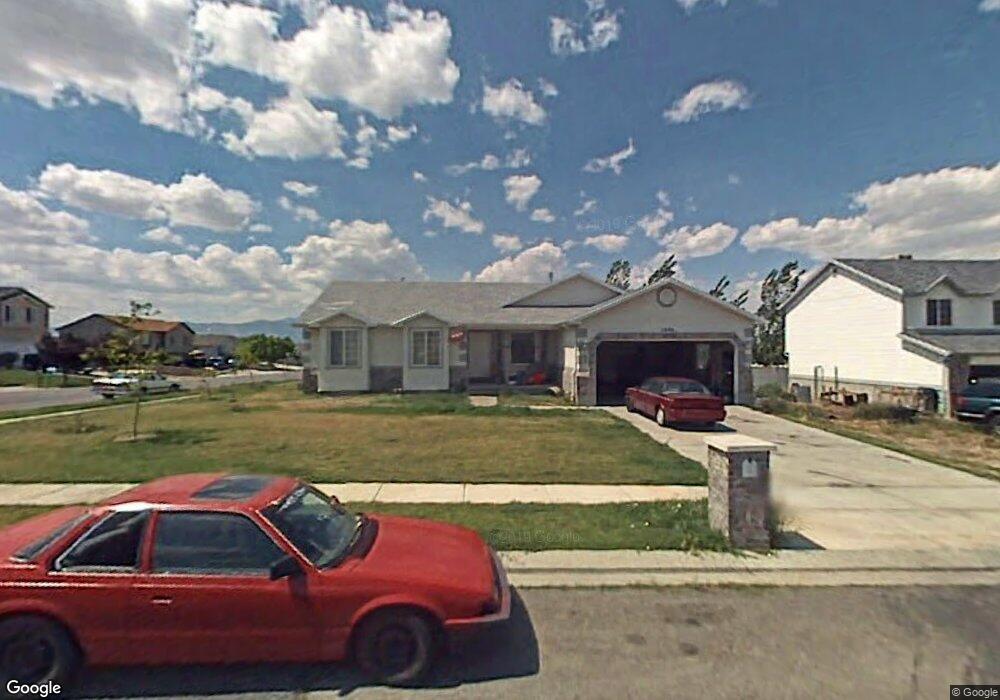
1093 N 490 E Tooele, UT 84074
Estimated Value: $486,000 - $599,000
5
Beds
4
Baths
3,490
Sq Ft
$155/Sq Ft
Est. Value
About This Home
This home is located at 1093 N 490 E, Tooele, UT 84074 and is currently estimated at $542,528, approximately $155 per square foot. 1093 N 490 E is a home located in Tooele County with nearby schools including Copper Canyon Elementary School, Clarke N. Johnsen Junior High School, and Stansbury High School.
Ownership History
Date
Name
Owned For
Owner Type
Purchase Details
Closed on
Mar 31, 2021
Sold by
Rice Baze C
Bought by
Quinonez Sibia
Current Estimated Value
Purchase Details
Closed on
Nov 16, 2018
Sold by
Hallock Riley J and Taylor Abigail R
Bought by
Rice Baze C
Home Financials for this Owner
Home Financials are based on the most recent Mortgage that was taken out on this home.
Original Mortgage
$279,837
Interest Rate
4.87%
Mortgage Type
FHA
Purchase Details
Closed on
Aug 18, 2016
Sold by
Hm Homes Llc
Bought by
Hallock Riley J and Taylor Abigail R
Home Financials for this Owner
Home Financials are based on the most recent Mortgage that was taken out on this home.
Original Mortgage
$246,683
Interest Rate
3.41%
Mortgage Type
New Conventional
Purchase Details
Closed on
Feb 23, 2016
Sold by
Allred Penny
Bought by
Hm Homes Llc and Graham Treavy
Create a Home Valuation Report for This Property
The Home Valuation Report is an in-depth analysis detailing your home's value as well as a comparison with similar homes in the area
Purchase History
| Date | Buyer | Sale Price | Title Company |
|---|---|---|---|
| Quinonez Sibia | -- | Title Guarantee | |
| Rice Baze C | -- | Security Title Insurance Age | |
| Hallock Riley J | -- | Security Title Insurance Age | |
| Hm Homes Llc | -- | Security Title Insurance Age |
Source: Public Records
Mortgage History
| Date | Status | Borrower | Loan Amount |
|---|---|---|---|
| Previous Owner | Rice Baze C | $279,837 | |
| Previous Owner | Hallock Riley J | $246,683 |
Source: Public Records
Tax History
| Year | Tax Paid | Tax Assessment Tax Assessment Total Assessment is a certain percentage of the fair market value that is determined by local assessors to be the total taxable value of land and additions on the property. | Land | Improvement |
|---|---|---|---|---|
| 2025 | $3,457 | $524,197 | $106,250 | $417,947 |
| 2024 | $3,787 | $289,075 | $58,438 | $230,637 |
| 2023 | $3,787 | $305,523 | $55,649 | $249,874 |
| 2022 | $3,441 | $296,036 | $55,774 | $240,262 |
| 2021 | $2,510 | $180,628 | $22,310 | $158,318 |
| 2020 | $2,384 | $297,573 | $40,563 | $257,010 |
| 2019 | $2,233 | $274,208 | $40,563 | $233,645 |
| 2018 | $2,087 | $243,004 | $45,000 | $198,004 |
| 2017 | $1,840 | $254,214 | $30,000 | $224,214 |
| 2016 | $1,492 | $123,733 | $16,500 | $107,233 |
| 2015 | $1,492 | $108,484 | $0 | $0 |
| 2014 | -- | $108,484 | $0 | $0 |
Source: Public Records
Map
Nearby Homes
Your Personal Tour Guide
Ask me questions while you tour the home.