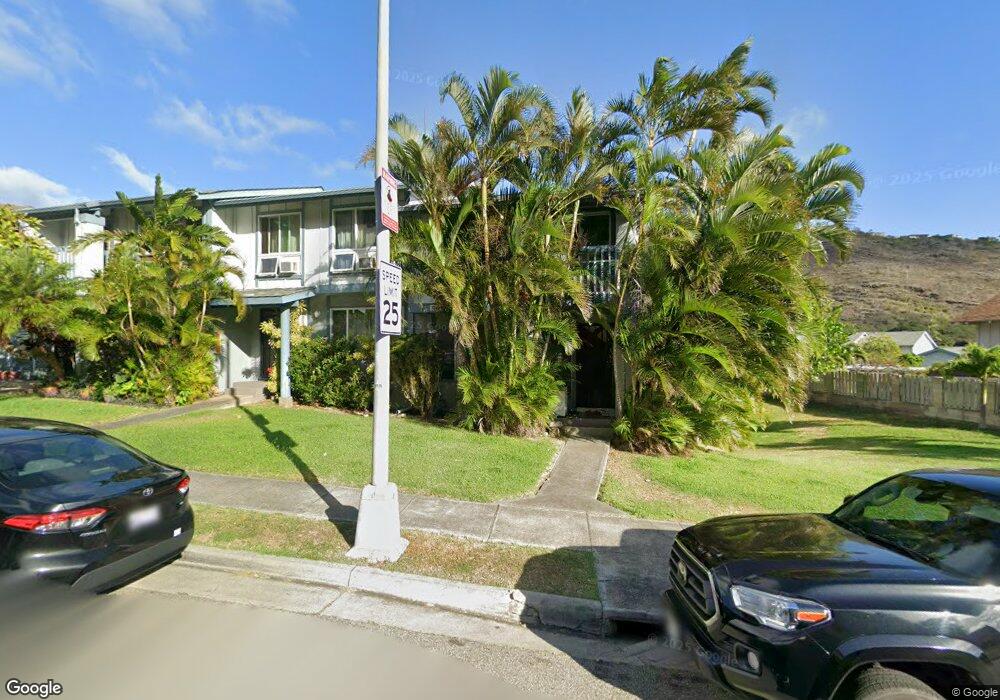
1093 Wainiha St Unit C Honolulu, HI 96825
Hawaii Kai NeighborhoodEstimated Value: $740,000 - $855,000
3
Beds
2
Baths
567
Sq Ft
$1,428/Sq Ft
Est. Value
About This Home
This home is located at 1093 Wainiha St Unit C, Honolulu, HI 96825 and is currently estimated at $809,888, approximately $1,428 per square foot. 1093 Wainiha St Unit C is a home located in Honolulu County with nearby schools including Kamiloiki Elementary School and Niu Valley Middle School.
Ownership History
Date
Name
Owned For
Owner Type
Purchase Details
Closed on
Sep 10, 2014
Sold by
Jasper Carol
Bought by
Jasper Carol Yanagisa
Current Estimated Value
Purchase Details
Closed on
Mar 29, 2005
Sold by
Guevara Varin J and Guevara Yasuko K
Bought by
Jasper Carol
Purchase Details
Closed on
Nov 30, 2001
Sold by
Tonaki Toby Moriaki and Tonaki Dyann L
Bought by
Guevara Varin J and Guevara Yasuko K
Home Financials for this Owner
Home Financials are based on the most recent Mortgage that was taken out on this home.
Original Mortgage
$177,000
Interest Rate
6.67%
Purchase Details
Closed on
Aug 16, 1995
Sold by
Leong Sharlene Leilani
Bought by
Tonaki Toby Moriaki and Lee Dyann Gim Ngan
Home Financials for this Owner
Home Financials are based on the most recent Mortgage that was taken out on this home.
Original Mortgage
$237,500
Interest Rate
7.5%
Create a Home Valuation Report for This Property
The Home Valuation Report is an in-depth analysis detailing your home's value as well as a comparison with similar homes in the area
Home Values in the Area
Average Home Value in this Area
Purchase History
| Date | Buyer | Sale Price | Title Company |
|---|---|---|---|
| Jasper Carol Yanagisa | -- | None Available | |
| Jasper Carol Yanagisa | -- | None Available | |
| Jasper Carol | $439,000 | Tg | |
| Guevara Varin J | $237,000 | -- | |
| Tonaki Toby Moriaki | $250,000 | -- |
Source: Public Records
Mortgage History
| Date | Status | Borrower | Loan Amount |
|---|---|---|---|
| Previous Owner | Guevara Varin J | $177,000 | |
| Previous Owner | Tonaki Toby Moriaki | $237,500 |
Source: Public Records
Tax History Compared to Growth
Tax History
| Year | Tax Paid | Tax Assessment Tax Assessment Total Assessment is a certain percentage of the fair market value that is determined by local assessors to be the total taxable value of land and additions on the property. | Land | Improvement |
|---|---|---|---|---|
| 2025 | $1,652 | $801,200 | $315,400 | $485,800 |
| 2024 | $1,652 | $632,000 | $315,400 | $316,600 |
| 2023 | $1,343 | $623,700 | $315,400 | $308,300 |
| 2022 | $1,695 | $624,400 | $315,400 | $309,000 |
| 2021 | $1,741 | $637,400 | $315,400 | $322,000 |
| 2020 | $1,691 | $623,100 | $315,400 | $307,700 |
| 2019 | $1,721 | $611,800 | $315,400 | $296,400 |
| 2018 | $1,784 | $629,700 | $315,400 | $314,300 |
| 2017 | $1,759 | $622,500 | $315,400 | $307,100 |
| 2016 | $1,750 | $619,900 | $315,400 | $304,500 |
| 2015 | $1,646 | $550,300 | $315,400 | $234,900 |
| 2014 | $1,405 | $529,200 | $315,400 | $213,800 |
Source: Public Records
Map
Nearby Homes
- 1125 Wainiha St Unit D
- 1136 Kumukumu St Unit D
- 123 Waihili Place
- 1062 Hoa St
- 1007 Hanohano Way
- 1205 Lunalilo Home Rd
- 1327 Kamehame Dr
- 7440 Kamehame Place
- 00 Kamehame Dr
- 132 Hoolako Place
- 7223 Naohe St
- 823 Kalalea St
- 7227 Pikoni Place
- 120 & 128 Hanapepe Loop
- 1262 Pihana St
- 7533 Kamaomao Place
- 7540 Puumahoe Place
- 7190 Hawaii Kai Dr Unit 271
- 649 Kealahou St
- 1048 Kaupaku Place
- 1093 Wainiha St Unit B
- 1093 Wainiha St Unit D
- 1093 Wainiha St Unit A
- 1093 Wainiha St Unit 1093B
- 1101 Wainiha St Unit C
- 1101 Wainiha St Unit B
- 1101 Wainiha St Unit A
- 1101 Wainiha St Unit E
- 1101 Wainiha St Unit D
- 1101 Wainiha St Unit F
- 1090 Wainiha St Unit B
- 1090 Wainiha St Unit C
- 1090 Wainiha St Unit A
- 1090 Wainiha St Unit D
- 1083 Wainiha St Unit PHA
- 992 Awaawaanoa Place Unit B
- 992 Awaawaanoa Place Unit C
- 992 Awaawaanoa Place Unit D
- 992 Awaawaanoa Place Unit A
- 996 Awaawaanoa Place Unit A