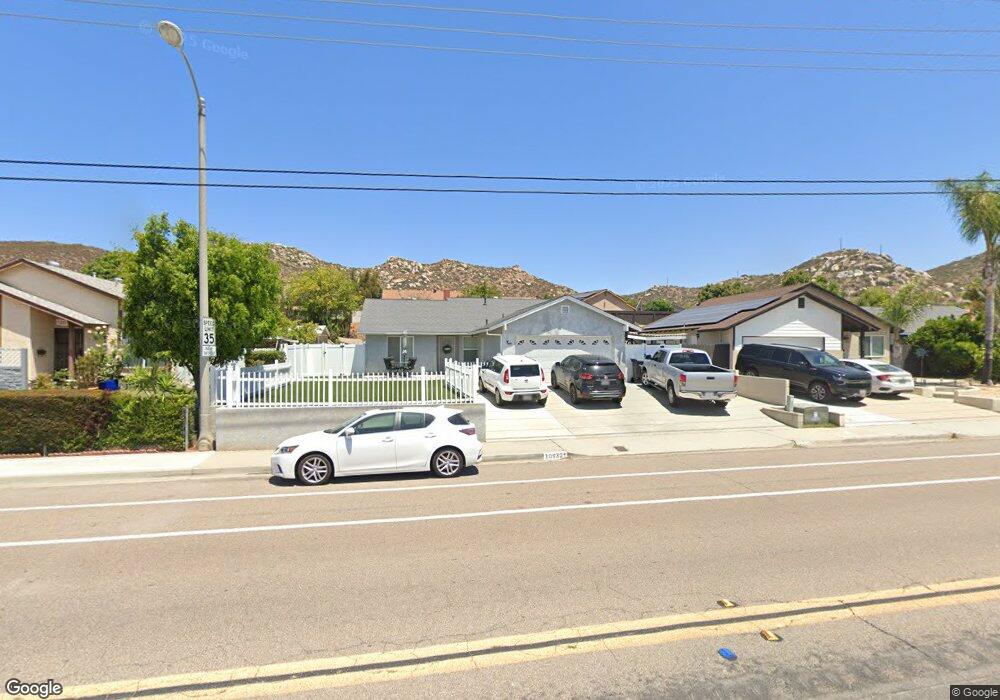
10932 El Nopal Lakeside, CA 92040
Estimated Value: $783,000 - $855,000
4
Beds
2
Baths
1,372
Sq Ft
$593/Sq Ft
Est. Value
About This Home
This home is located at 10932 El Nopal, Lakeside, CA 92040 and is currently estimated at $813,317, approximately $592 per square foot. 10932 El Nopal is a home located in San Diego County with nearby schools including Lakeside Farms Elementary School, Lakeside Middle School, and Santana High School.
Ownership History
Date
Name
Owned For
Owner Type
Purchase Details
Closed on
Apr 27, 2021
Sold by
Deen Robert Martin and Deen Bob
Bought by
Deen Mary M
Current Estimated Value
Purchase Details
Closed on
Oct 19, 2020
Sold by
Deen Robert M and Deen Mary M
Bought by
Deen Robert M and Deen Mary M
Home Financials for this Owner
Home Financials are based on the most recent Mortgage that was taken out on this home.
Original Mortgage
$385,000
Interest Rate
2.8%
Mortgage Type
New Conventional
Purchase Details
Closed on
Jun 26, 2017
Sold by
Deen Robert M and Deen Mary M
Bought by
Deen Robert M and Deen Mary M
Home Financials for this Owner
Home Financials are based on the most recent Mortgage that was taken out on this home.
Original Mortgage
$379,500
Interest Rate
4.02%
Mortgage Type
New Conventional
Purchase Details
Closed on
Jun 21, 2017
Sold by
Deen Robert M and Deen Mary M
Bought by
Deen Robert M and Deen Mary M
Home Financials for this Owner
Home Financials are based on the most recent Mortgage that was taken out on this home.
Original Mortgage
$379,500
Interest Rate
4.02%
Mortgage Type
New Conventional
Purchase Details
Closed on
May 21, 2015
Sold by
Deen Robert M and Deen Mary M
Bought by
The Robert Martin Deen & Mary Margaret D and Deen Mary M
Home Financials for this Owner
Home Financials are based on the most recent Mortgage that was taken out on this home.
Original Mortgage
$389,738
Interest Rate
3.64%
Mortgage Type
FHA
Purchase Details
Closed on
Jul 30, 2014
Sold by
Deen Robert M and Deen Mary M
Bought by
Deen Robert M and Deen Mary M
Home Financials for this Owner
Home Financials are based on the most recent Mortgage that was taken out on this home.
Original Mortgage
$389,885
Interest Rate
4.11%
Mortgage Type
FHA
Purchase Details
Closed on
Jun 29, 2010
Sold by
Deen Robert M and Deen Mary M
Bought by
Deen Robert M and Deen Mary M
Purchase Details
Closed on
Oct 15, 2008
Sold by
Deen Robert M and Deen Mary M
Bought by
Deen Robert M and Deen Mary M
Purchase Details
Closed on
Dec 16, 1998
Sold by
Howland William K and Howland Roberta L
Bought by
B & B Properties 2000 Lp
Purchase Details
Closed on
Jul 20, 1998
Sold by
Howland William K and Howland Roberta L
Bought by
Howland William Kelton and Howland Roberta Lynn
Create a Home Valuation Report for This Property
The Home Valuation Report is an in-depth analysis detailing your home's value as well as a comparison with similar homes in the area
Purchase History
We collect this data history from publicly available records. To have your information removed, we recommend requesting removal directly through your county’s website.
| Date | Buyer | Sale Price | Title Company |
|---|---|---|---|
| Deen Mary M | -- | -- | |
| Deen Robert M | -- | Western Resource Title | |
| Deen Robert M | -- | Western Resources Title | |
| Deen Robert M | -- | Placer Title Company | |
| Deen Robert M | -- | Placer Title Company | |
| The Robert Martin Deen & Mary Margaret D | -- | Placer Title Company | |
| Deen Robert M | -- | Placer Title Company | |
| Deen Robert M | -- | Placer Title Company | |
| Deen Robert M | -- | Placer Title Company | |
| Deen Robert M | -- | None Available | |
| Deen Robert M | -- | None Available | |
| Deen Robert M | -- | None Available | |
| Deen Robert M | -- | None Available | |
| B & B Properties 2000 Lp | -- | -- | |
| Howland William Kelton | -- | -- |
Source: Public Records
Mortgage History
We collect this data history from publicly available records. To have your information removed, we recommend requesting removal directly through your county’s website.
| Date | Status | Borrower | Loan Amount |
|---|---|---|---|
| Previous Owner | Deen Robert M | $385,000 | |
| Previous Owner | Deen Robert M | $379,500 | |
| Previous Owner | Deen Robert M | $389,738 | |
| Previous Owner | Deen Robert M | $389,885 |
Source: Public Records
Tax History
| Year | Tax Paid | Tax Assessment Tax Assessment Total Assessment is a certain percentage of the fair market value that is determined by local assessors to be the total taxable value of land and additions on the property. | Land | Improvement |
|---|---|---|---|---|
| 2025 | $4,772 | $401,813 | $162,497 | $239,316 |
| 2024 | $4,772 | $393,935 | $159,311 | $234,624 |
| 2023 | $4,603 | $386,212 | $156,188 | $230,024 |
| 2022 | $4,530 | $378,640 | $153,126 | $225,514 |
| 2021 | $4,465 | $371,217 | $150,124 | $221,093 |
| 2020 | $4,415 | $367,411 | $148,585 | $218,826 |
| 2019 | $4,337 | $360,208 | $145,672 | $214,536 |
| 2018 | $4,284 | $353,146 | $142,816 | $210,330 |
| 2017 | $4,224 | $346,222 | $140,016 | $206,206 |
| 2016 | $4,104 | $339,434 | $137,271 | $202,163 |
| 2015 | $4,076 | $334,337 | $135,210 | $199,127 |
| 2014 | -- | $327,789 | $132,562 | $195,227 |
Source: Public Records
Map
Nearby Homes
- 10252 Santana St
- 10828 Len St
- 10459 Santana St
- 10812 2nd St
- 10738 2nd St
- 10704 El Nopal
- 10658 Shady Meadow Loop
- 10252 Riverhill Ln
- 10149 Carreta Dr
- 11320 El Nopal Unit 5619
- 9947 Cleary St
- 10131 Carreta Dr
- 10161 Riverhill Ln
- 10520 El Nopal
- 10083 W Glendon Cir
- 10424 2nd St
- 9715 Kenesaw Ct
- 11436 El Nopal
- 10009 Santana Ranch Ln
- 9952 N Magnolia Ave
- 10926 El Nopal
- 10938 El Nopal
- 10933 Magna Ln
- 10944 El Nopal
- 10920 El Nopal
- 10927 Magna Ln
- 10937 Magna Ln
- 10921 Magna Ln
- 10950 El Nopal
- 10914 El Nopal
- 10933 El Nopal
- 10927 El Nopal
- 10939 Magna Ln
- 10939 El Nopal
- 10915 Magna Ln
- 10921 El Nopal
- 10956 El Nopal
- 10908 El Nopal
- 10915 El Nopal
- 10957 Gayola Ln
Your Personal Tour Guide
Ask me questions while you tour the home.