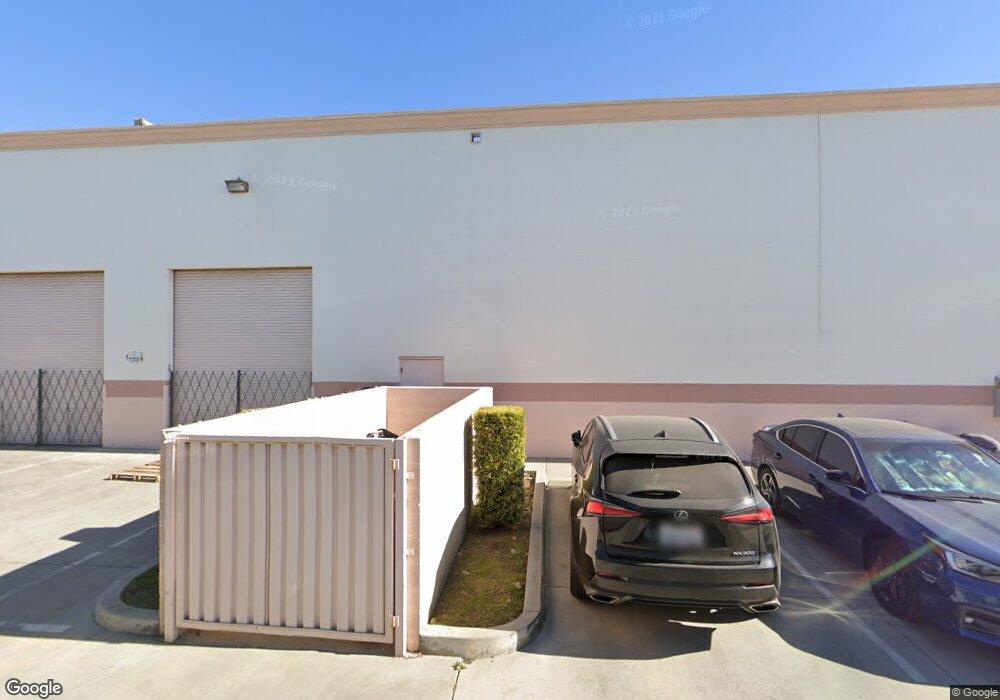
10932 Klingerman St Unit C El Monte, CA 91733
Estimated Value: $1,625,626
--
Bed
--
Bath
4,240
Sq Ft
$383/Sq Ft
Est. Value
About This Home
This home is located at 10932 Klingerman St Unit C, El Monte, CA 91733 and is currently estimated at $1,625,626, approximately $383 per square foot. 10932 Klingerman St Unit C is a home located in Los Angeles County with nearby schools including Miramonte Elementary, South El Monte High School, and Epiphany Catholic School.
Ownership History
Date
Name
Owned For
Owner Type
Purchase Details
Closed on
Mar 1, 2021
Sold by
Park Ryan and Park Jihee
Bought by
Botast Llc
Current Estimated Value
Home Financials for this Owner
Home Financials are based on the most recent Mortgage that was taken out on this home.
Original Mortgage
$625,000
Outstanding Balance
$560,268
Interest Rate
2.7%
Mortgage Type
New Conventional
Estimated Equity
$1,065,358
Purchase Details
Closed on
Oct 21, 2019
Sold by
Hh Dorje Chang Buddha Iii Cultural & Art
Bought by
Park Ryan and Park Jihee
Home Financials for this Owner
Home Financials are based on the most recent Mortgage that was taken out on this home.
Original Mortgage
$600,000
Interest Rate
3.7%
Mortgage Type
Commercial
Purchase Details
Closed on
Jan 21, 2016
Sold by
Master Wan Ko Yee International Cultural
Bought by
H H Dorje Chang Buddha Iii Cultural & Ar
Purchase Details
Closed on
Apr 22, 2013
Sold by
Sawyer Enterprises Llc
Bought by
Master Wan Ko Yee International Cultural
Create a Home Valuation Report for This Property
The Home Valuation Report is an in-depth analysis detailing your home's value as well as a comparison with similar homes in the area
Home Values in the Area
Average Home Value in this Area
Purchase History
| Date | Buyer | Sale Price | Title Company |
|---|---|---|---|
| Botast Llc | $1,250,000 | Chicago Title | |
| Park Ryan | $935,000 | Lawyers Title | |
| H H Dorje Chang Buddha Iii Cultural & Ar | -- | None Available | |
| Master Wan Ko Yee International Cultural | $551,500 | Old Republic Ttile Co La |
Source: Public Records
Mortgage History
| Date | Status | Borrower | Loan Amount |
|---|---|---|---|
| Open | Botast Llc | $625,000 | |
| Previous Owner | Park Ryan | $600,000 |
Source: Public Records
Tax History Compared to Growth
Tax History
| Year | Tax Paid | Tax Assessment Tax Assessment Total Assessment is a certain percentage of the fair market value that is determined by local assessors to be the total taxable value of land and additions on the property. | Land | Improvement |
|---|---|---|---|---|
| 2025 | $16,948 | $1,353,038 | $772,855 | $580,183 |
| 2024 | $16,948 | $1,326,508 | $757,701 | $568,807 |
| 2023 | $16,614 | $1,300,499 | $742,845 | $557,654 |
| 2022 | $16,193 | $1,275,000 | $728,280 | $546,720 |
| 2021 | $12,392 | $944,686 | $540,542 | $404,144 |
| 2020 | $11,990 | $935,000 | $535,000 | $400,000 |
| 2019 | $8,337 | $608,800 | $220,780 | $388,020 |
| 2018 | $7,839 | $596,863 | $216,451 | $380,412 |
| 2016 | $7,121 | $573,688 | $208,047 | $365,641 |
| 2015 | $7,052 | $565,071 | $204,922 | $360,149 |
| 2014 | $6,896 | $554,003 | $200,908 | $353,095 |
Source: Public Records
Map
Nearby Homes
- 11034 Klingerman St
- 11106 Klingerman St Unit 6
- 10829 Elliott Ave
- 2300 Granada Ave
- 11203 Redberry St
- 11221 Fineview St
- 11139 Elliott Ave Unit D
- 2225 Santa Anita Ave
- 2145 Cogswell Rd
- 2723 Tyler Ave
- 1948 Floradale Ave
- 11131 Dodson St Unit 7
- 11331 Elliott Ave Unit 21
- 2822 Gage Ave
- 2509 Floradale Ave
- 12046 Klingerman St
- 2429 Central Ave
- 3051 Nevada Ave
- 2503 Central Ave
- 2821 Musgrove Ave
- 10942 Klingerman St
- 10932 Klingerman St
- 10942 Klingerman St Unit A
- 10942 Klingerman Unit A St
- 10948 Klingerman St
- 10945 Klingerman St
- 10922 Klingerman St
- 10937 Klingerman St
- 10943 Klingerman St
- 10931 Klingerman St
- 10908 Klingerman St
- 10923 Klingerman St
- 10953 Klingerman St
- 2403 Tyler Ave
- 2322 Continental Ave Unit 1
- 2322 Continental Ave
- 2322 Continental Ave Unit 6
- 2332 Continental Ave
- 2407 Tyler Ave
- 2340 Continental Ave