10935 Savannah Landing Cir Unit 58 Orlando, FL 32832
East Park NeighborhoodEstimated Value: $309,000 - $373,000
3
Beds
3
Baths
1,328
Sq Ft
$258/Sq Ft
Est. Value
About This Home
This home is located at 10935 Savannah Landing Cir Unit 58, Orlando, FL 32832 and is currently estimated at $342,094, approximately $257 per square foot. 10935 Savannah Landing Cir Unit 58 is a home located in Orange County with nearby schools including Lake Nona Middle, Lake Nona High, and Cranium Academy - East Orlando.
Ownership History
Date
Name
Owned For
Owner Type
Purchase Details
Closed on
Jan 28, 2021
Sold by
Cameron Matthew Thomas
Bought by
Cameron Matthew Thomas
Current Estimated Value
Home Financials for this Owner
Home Financials are based on the most recent Mortgage that was taken out on this home.
Original Mortgage
$192,000
Outstanding Balance
$171,425
Interest Rate
2.6%
Mortgage Type
New Conventional
Estimated Equity
$170,669
Purchase Details
Closed on
Jul 1, 2017
Bought by
Amorese Vitantoni
Purchase Details
Closed on
Oct 14, 2011
Sold by
Lennar Homes Llc
Bought by
Lopez Dirgny Coromoto Clemente
Purchase Details
Closed on
Apr 29, 2011
Sold by
Slv Nona Terrace L L C
Bought by
Lennar Homes Llc
Create a Home Valuation Report for This Property
The Home Valuation Report is an in-depth analysis detailing your home's value as well as a comparison with similar homes in the area
Home Values in the Area
Average Home Value in this Area
Purchase History
| Date | Buyer | Sale Price | Title Company |
|---|---|---|---|
| Cameron Matthew Thomas | $240,000 | Omega Title | |
| Amorese Vitantoni | $205,000 | -- | |
| Lopez Dirgny Coromoto Clemente | $165,000 | North American Title Company | |
| Lennar Homes Llc | $150,000 | Attorney |
Source: Public Records
Mortgage History
| Date | Status | Borrower | Loan Amount |
|---|---|---|---|
| Open | Cameron Matthew Thomas | $192,000 |
Source: Public Records
Tax History Compared to Growth
Tax History
| Year | Tax Paid | Tax Assessment Tax Assessment Total Assessment is a certain percentage of the fair market value that is determined by local assessors to be the total taxable value of land and additions on the property. | Land | Improvement |
|---|---|---|---|---|
| 2025 | $4,659 | $279,680 | $70,000 | $209,680 |
| 2024 | $4,160 | $279,680 | $70,000 | $209,680 |
| 2023 | $4,160 | $263,897 | $70,000 | $193,897 |
| 2022 | $3,643 | $217,584 | $55,000 | $162,584 |
| 2021 | $3,142 | $182,447 | $40,000 | $142,447 |
| 2020 | $2,897 | $173,512 | $30,000 | $143,512 |
| 2019 | $3,066 | $174,576 | $30,000 | $144,576 |
| 2018 | $3,038 | $170,716 | $30,000 | $140,716 |
| 2017 | $2,831 | $156,937 | $20,000 | $136,937 |
| 2016 | $2,796 | $152,736 | $20,000 | $132,736 |
| 2015 | $2,921 | $156,151 | $20,000 | $136,151 |
| 2014 | $2,749 | $141,889 | $20,000 | $121,889 |
Source: Public Records
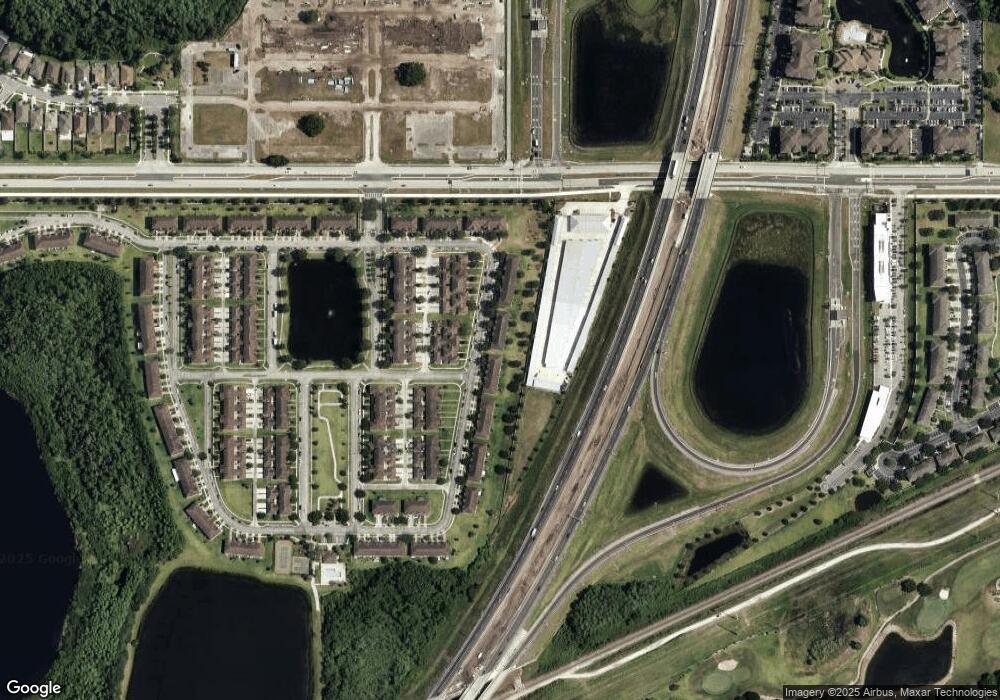
Map
Nearby Homes
- 9009 Savannah Julip Ln
- 10811 Savannah Landing Cir
- 10975 Savannah Landing Cir
- 10733 Savannah Landing Cir
- 10709 Savannah Landing Cir
- 11179 Savannah Landing Cir
- 9441 Flowering Cottonwood Rd Unit 41
- 10888 Eclipse Lily Way Unit 62A
- 9323 Flowering Cottonwood Rd Unit 22
- 10519 Eastpark Lake Dr
- 10350 Lake District Ln Unit S
- 9423 Myrtle Creek Ln Unit 510
- 10472 Eastpark Lake Dr
- 10786 Savannah Wood Dr Unit 126
- 9341 Jasmine Flower Ln Unit 178
- 9809 Osprey Landing Dr
- 10914 Savannah Wood Dr Unit 139
- 10852 Spider Lily Dr Unit 14C
- 10791 Gran Paradiso Dr Unit S
- 10435 Eastpark Lake Dr
- 10935 Savannah Landing Cir
- 10931 Savannah Landing Cir
- 10931 Savannah Landing Cir Unit 57
- 10939 Savannah Landing Cir
- 10927 Savannah Landing Cir
- 10943 Savannah Landing Cir
- 10923 Savannah Landing Cir
- 10923 Savannah Landing Cir Unit 10919
- 10947 Savannah Landing Cir
- 10919 Savannah Landing Cir
- 10919 Savannah Landing Cir Unit 10919
- 10951 Savannah Landing Cir
- 10915 Savannah Landing Cir
- 10915 Savannah Landing Cir Unit 10919
- 10955 Savannah Landing Cir
- 10959 Savannah Landing Cir
- 10911 Savannah Landing Cir
- 10934 Savannah Landing Cir
- 10930 Savannah Landing Cir
- 10907 Savannah Landing Cir