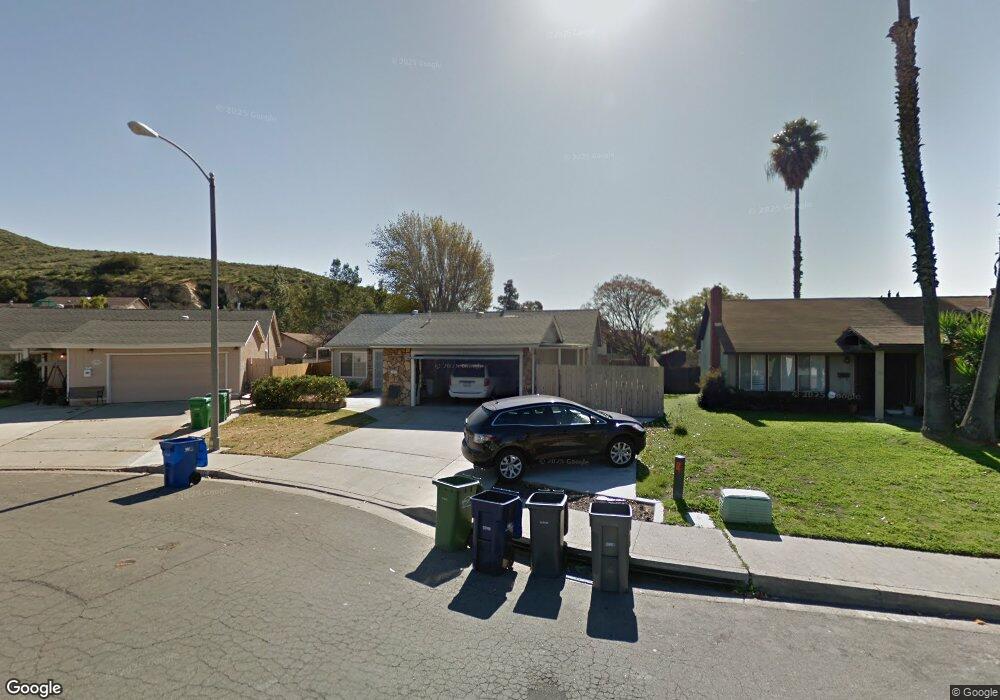
10939 Greencastle St Santee, CA 92071
Estimated Value: $819,000 - $868,000
3
Beds
2
Baths
1,515
Sq Ft
$557/Sq Ft
Est. Value
About This Home
This home is located at 10939 Greencastle St, Santee, CA 92071 and is currently estimated at $844,555, approximately $557 per square foot. 10939 Greencastle St is a home located in San Diego County with nearby schools including Hill Creek Elementary School, Santana High School, and River Valley Charter School.
Ownership History
Date
Name
Owned For
Owner Type
Purchase Details
Closed on
Jan 20, 1999
Sold by
Willard Steve and Willard Jennifer
Bought by
Home Of Guiding Hands Corp
Current Estimated Value
Home Financials for this Owner
Home Financials are based on the most recent Mortgage that was taken out on this home.
Original Mortgage
$170,910
Outstanding Balance
$39,198
Interest Rate
6.63%
Estimated Equity
$805,357
Purchase Details
Closed on
Nov 4, 1997
Sold by
Vasek James R and Vasek Cynthia L
Bought by
Willard Steve and Willard Jennifer
Home Financials for this Owner
Home Financials are based on the most recent Mortgage that was taken out on this home.
Original Mortgage
$165,593
Interest Rate
7.3%
Mortgage Type
FHA
Purchase Details
Closed on
Aug 13, 1996
Sold by
Vasek James R and Vasek Cynthia L
Bought by
Vasek James and Vasek Cynthia
Create a Home Valuation Report for This Property
The Home Valuation Report is an in-depth analysis detailing your home's value as well as a comparison with similar homes in the area
Purchase History
We collect this data history from publicly available records. To have your information removed, we recommend requesting removal directly through your county’s website.
| Date | Buyer | Sale Price | Title Company |
|---|---|---|---|
| Home Of Guiding Hands Corp | $190,000 | Lawyers Title | |
| Willard Steve | $169,500 | Chicago Title | |
| Vasek James | -- | -- |
Source: Public Records
Mortgage History
We collect this data history from publicly available records. To have your information removed, we recommend requesting removal directly through your county’s website.
| Date | Status | Borrower | Loan Amount |
|---|---|---|---|
| Open | Home Of Guiding Hands Corp | $170,910 | |
| Previous Owner | Willard Steve | $165,593 |
Source: Public Records
Tax History
| Year | Tax Paid | Tax Assessment Tax Assessment Total Assessment is a certain percentage of the fair market value that is determined by local assessors to be the total taxable value of land and additions on the property. | Land | Improvement |
|---|---|---|---|---|
| 2025 | $162 | $297,681 | $109,728 | $187,953 |
| 2024 | $162 | $291,845 | $107,577 | $184,268 |
| 2023 | $157 | $286,123 | $105,468 | $180,655 |
| 2022 | $151 | $280,513 | $103,400 | $177,113 |
| 2021 | $147 | $275,014 | $101,373 | $173,641 |
| 2020 | $146 | $272,195 | $100,334 | $171,861 |
| 2019 | $144 | $266,859 | $98,367 | $168,492 |
| 2018 | $142 | $261,628 | $96,439 | $165,189 |
| 2017 | $160 | $256,499 | $94,549 | $161,950 |
| 2016 | $137 | $251,471 | $92,696 | $158,775 |
| 2015 | $136 | $247,695 | $91,304 | $156,391 |
| 2014 | $135 | $242,844 | $89,516 | $153,328 |
Source: Public Records
Map
Nearby Homes
- 9715 Kenesaw Ct
- 10812 2nd St
- 9947 Cleary St
- 10738 2nd St
- 10642 Shady Meadow Loop
- 10658 Shady Meadow Loop
- 10161 Riverhill Ln
- 10252 Riverhill Ln
- 10252 Santana St
- 9697 Bundy Dr
- 10131 Carreta Dr
- 10704 El Nopal
- 10424 2nd St
- 11320 El Nopal Unit 5619
- 10009 Santana Ranch Ln
- 10520 El Nopal
- 10154 W Glendon Cir
- 10347 Carefree Dr
- 10333 Carefree Dr
- 10357 Carefree Dr
- 10931 Greencastle St
- 10947 Greencastle St
- 10929 Greencastle St
- 10932 Grand Fork Dr
- 9907 Donner St
- 10946 Grand Fork Dr
- 10925 Greencastle St
- 10934 Greencastle St
- 10926 Grand Fork Dr
- 9913 Donner St
- 10919 Greencastle St
- 10928 Greencastle St
- 10939 Grand Fork Dr
- 9914 Los Ranchitos Rd
- 9908 Los Ranchitos Rd
- 9919 Donner St
- 10933 Grand Fork Dr
- 10920 Grand Fork Dr
- 9920 Los Ranchitos Rd
- 10922 Greencastle St
Your Personal Tour Guide
Ask me questions while you tour the home.