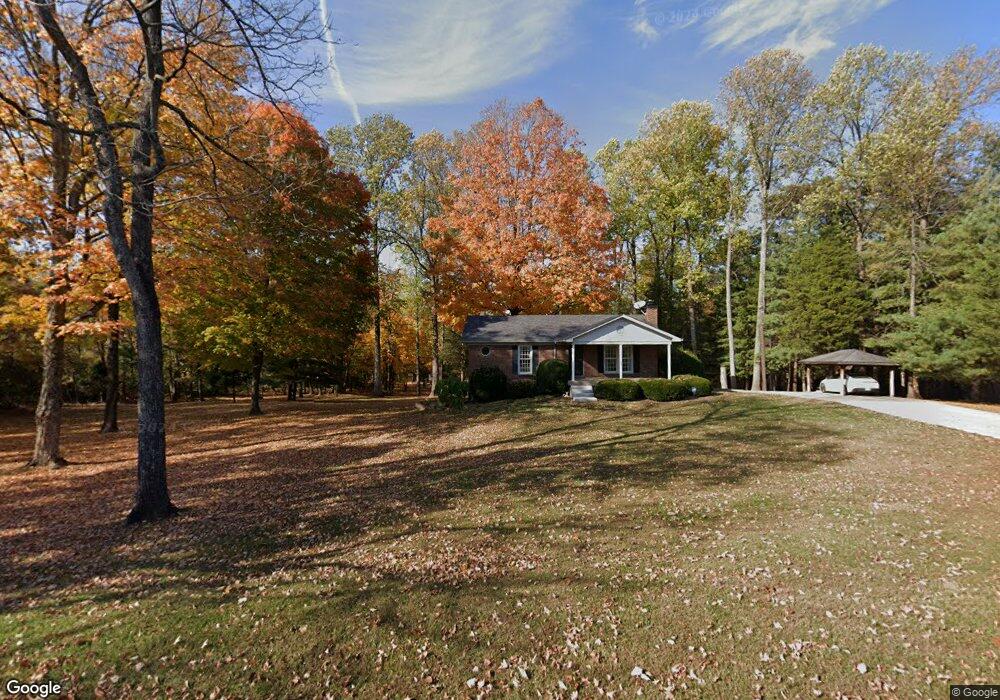
10939 Tarrence Rd Louisville, KY 40299
Estimated Value: $469,000 - $647,305
3
Beds
4
Baths
3,483
Sq Ft
$153/Sq Ft
Est. Value
About This Home
This home is located at 10939 Tarrence Rd, Louisville, KY 40299 and is currently estimated at $533,826, approximately $153 per square foot. 10939 Tarrence Rd is a home located in Jefferson County with nearby schools including Tully Elementary School, Cochrane Elementary School, and Jeffersontown Elementary School.
Ownership History
Date
Name
Owned For
Owner Type
Purchase Details
Closed on
Oct 29, 2009
Sold by
Jordan James Patrick and Jordan Helen M
Bought by
Bivens James S and Bivens Sandra M
Current Estimated Value
Home Financials for this Owner
Home Financials are based on the most recent Mortgage that was taken out on this home.
Original Mortgage
$129,000
Outstanding Balance
$84,404
Interest Rate
5.04%
Mortgage Type
New Conventional
Estimated Equity
$449,422
Purchase Details
Closed on
Dec 15, 2008
Sold by
Leneave Christopher M and Marlowe Stephanie Frances
Bought by
Jordan James Patrick
Purchase Details
Closed on
Apr 28, 2005
Sold by
Akridge Joanne L
Bought by
Leneave Christopher M and Leneave Stephanie M
Home Financials for this Owner
Home Financials are based on the most recent Mortgage that was taken out on this home.
Original Mortgage
$318,750
Interest Rate
8.3%
Mortgage Type
Purchase Money Mortgage
Create a Home Valuation Report for This Property
The Home Valuation Report is an in-depth analysis detailing your home's value as well as a comparison with similar homes in the area
Home Values in the Area
Average Home Value in this Area
Purchase History
| Date | Buyer | Sale Price | Title Company |
|---|---|---|---|
| Bivens James S | $230,000 | None Available | |
| Jordan James Patrick | $277,500 | None Available | |
| Leneave Christopher M | $375,000 | None Available |
Source: Public Records
Mortgage History
| Date | Status | Borrower | Loan Amount |
|---|---|---|---|
| Open | Bivens James S | $129,000 | |
| Previous Owner | Leneave Christopher M | $318,750 |
Source: Public Records
Tax History Compared to Growth
Tax History
| Year | Tax Paid | Tax Assessment Tax Assessment Total Assessment is a certain percentage of the fair market value that is determined by local assessors to be the total taxable value of land and additions on the property. | Land | Improvement |
|---|---|---|---|---|
| 2024 | $5,726 | $504,510 | $160,810 | $343,700 |
| 2023 | $4,515 | $386,580 | $98,460 | $288,120 |
| 2022 | $4,453 | $386,580 | $98,460 | $288,120 |
| 2021 | $4,820 | $386,580 | $98,460 | $288,120 |
| 2020 | $4,648 | $401,730 | $86,180 | $315,550 |
| 2019 | $4,555 | $401,730 | $86,180 | $315,550 |
| 2018 | $4,501 | $401,730 | $86,180 | $315,550 |
| 2017 | $4,216 | $401,730 | $86,180 | $315,550 |
| 2013 | $3,250 | $325,000 | $73,860 | $251,140 |
Source: Public Records
Map
Nearby Homes
- 11306 Arbor Wood Dr
- 6612 Rockview Way
- 11321 Jefferson Trace Blvd
- 6705 Bluffview Cir
- 6716 Bluffview Cir
- 10206 Easum Rd
- 11201 Arbor Wood Dr
- 6636 Calm River Way
- 5627 Wooded Lake Dr
- 6716 Sycamore Bend Trace
- 11001 Walbridge Dr Ct
- 6604 Brook Falls Ct
- 5501 Billtown Rd
- 6503 Grey Oaks Ct
- 6703 Weather Vane Dr
- 7000 Hollow Oaks Dr
- 11891 Trottingham Cir
- 11903 Trottingham Cir
- 10004 Chenoweth Vista Way Unit 10004
- 6915 Beckingham Blvd
- 10901 Tarrence Rd
- 11007 Tarrence Rd
- 11006 Tarrence Rd
- 11008 Tarrence Rd
- 5620 Dogwood Blvd
- 11012 Tarrence Rd
- 11014 Tarrence Rd
- 5700 Dogwood Blvd
- 6006 Billtown Rd
- 5907 Billtown Rd
- 6101 Billtown Rd
- 6512 Billtown Rd
- 11339 Arbor Wood Dr
- 11337 Arbor Wood Dr
- 11325 Arbor Wood Dr
- 11335 Arbor Wood Dr
- 6107 Billtown Rd
- 11323 Arbor Wood Dr
- 6105 Billtown Rd
- 11333 Arbor Wood Dr