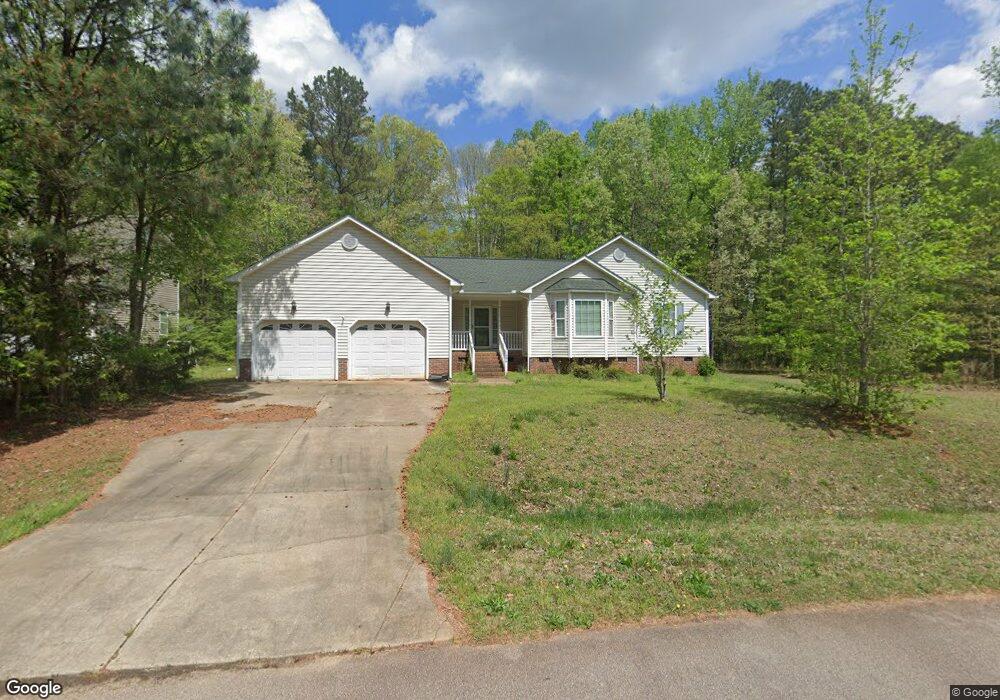
1094 Alderman Cir Raleigh, NC 27603
Estimated Value: $406,000 - $475,000
3
Beds
3
Baths
1,957
Sq Ft
$220/Sq Ft
Est. Value
About This Home
This home is located at 1094 Alderman Cir, Raleigh, NC 27603 and is currently estimated at $430,488, approximately $219 per square foot. 1094 Alderman Cir is a home located in Wake County with nearby schools including Banks Road Elementary School.
Ownership History
Date
Name
Owned For
Owner Type
Purchase Details
Closed on
Mar 10, 2009
Sold by
Isler Raymond E and Isler Leonia A
Bought by
Isler Raymond E
Current Estimated Value
Purchase Details
Closed on
Jun 21, 2007
Sold by
Faulkner Edna C and Faulkner Lawson P
Bought by
Isler Raymond E and Isler Leonia Annette
Home Financials for this Owner
Home Financials are based on the most recent Mortgage that was taken out on this home.
Original Mortgage
$196,000
Outstanding Balance
$112,833
Interest Rate
5.12%
Mortgage Type
Purchase Money Mortgage
Estimated Equity
$317,655
Purchase Details
Closed on
Jun 20, 2006
Sold by
Comfort Homes Inc
Bought by
Faulkner Edna C and Faulkner Lawson P
Home Financials for this Owner
Home Financials are based on the most recent Mortgage that was taken out on this home.
Original Mortgage
$161,000
Interest Rate
5.25%
Mortgage Type
Purchase Money Mortgage
Purchase Details
Closed on
Dec 16, 2005
Sold by
S Wake Properties Inc
Bought by
Comfort Homes Inc
Create a Home Valuation Report for This Property
The Home Valuation Report is an in-depth analysis detailing your home's value as well as a comparison with similar homes in the area
Home Values in the Area
Average Home Value in this Area
Purchase History
| Date | Buyer | Sale Price | Title Company |
|---|---|---|---|
| Isler Raymond E | -- | None Available | |
| Isler Raymond E | $196,000 | None Available | |
| Faulkner Edna C | $179,000 | None Available | |
| Comfort Homes Inc | $262,500 | None Available |
Source: Public Records
Mortgage History
| Date | Status | Borrower | Loan Amount |
|---|---|---|---|
| Open | Isler Raymond E | $196,000 | |
| Previous Owner | Faulkner Edna C | $161,000 |
Source: Public Records
Tax History Compared to Growth
Tax History
| Year | Tax Paid | Tax Assessment Tax Assessment Total Assessment is a certain percentage of the fair market value that is determined by local assessors to be the total taxable value of land and additions on the property. | Land | Improvement |
|---|---|---|---|---|
| 2025 | $2,584 | $400,918 | $80,000 | $320,918 |
| 2024 | $2,510 | $400,918 | $80,000 | $320,918 |
| 2023 | $2,070 | $262,973 | $42,000 | $220,973 |
| 2022 | $1,919 | $262,973 | $42,000 | $220,973 |
| 2021 | $1,868 | $262,973 | $42,000 | $220,973 |
| 2020 | $1,837 | $262,973 | $42,000 | $220,973 |
| 2019 | $1,786 | $216,217 | $38,000 | $178,217 |
| 2018 | $1,642 | $216,217 | $38,000 | $178,217 |
| 2017 | $1,557 | $216,217 | $38,000 | $178,217 |
| 2016 | $1,499 | $216,217 | $38,000 | $178,217 |
| 2015 | $1,348 | $191,223 | $38,000 | $153,223 |
| 2014 | $1,278 | $191,223 | $38,000 | $153,223 |
Source: Public Records
Map
Nearby Homes
- 10329 Fanny Brown Rd
- 1117 Leach St
- 5216 Relay Way
- 3205 Banks Rd
- 2704 Stageline Dr
- 1425 Tawny View Ln
- 9008 Chelsea Dr
- 5512 Glenhurst North Dr
- 3320 Highgate Rd
- 4008 Bankshire Ln
- 1200 Misty Morning Way
- 4012 Sorrell Brothers Ct
- 10917 Stage Dr
- 2600 Banks Rd Unit Lot 2
- 2600 Banks Rd Unit Lot 1
- 1017 Widgeon Way
- 9045 Chelsea Dr
- 1220 Turner Woods Dr
- 1005 Turner Meadow Dr
- 936 Elbridge Dr
- 1090 Alderman Cir
- 10433 Fanny Brown Rd
- 1098 Alderman Cir
- 1089 Alderman Cir
- 10425 Fanny Brown Rd
- 1093 Alderman Cir
- 1086 Alderman Cir
- 5200 Turning Branch Ln
- 1097 Alderman Cir
- 1085 Alderman Cir
- 5224 Turning Branch Ln
- 5108 Turning Branch Ln
- 10421 Fanny Brown Rd
- 10417 Fanny Brown Rd
- 5209 Turning Branch Ln
- 1021 Panther Springs Ct
- 5205 Turning Branch Ln
- 5228 Turning Branch Ln
- 1077 Alderman Cir
- 10500 Fanny Brown Rd