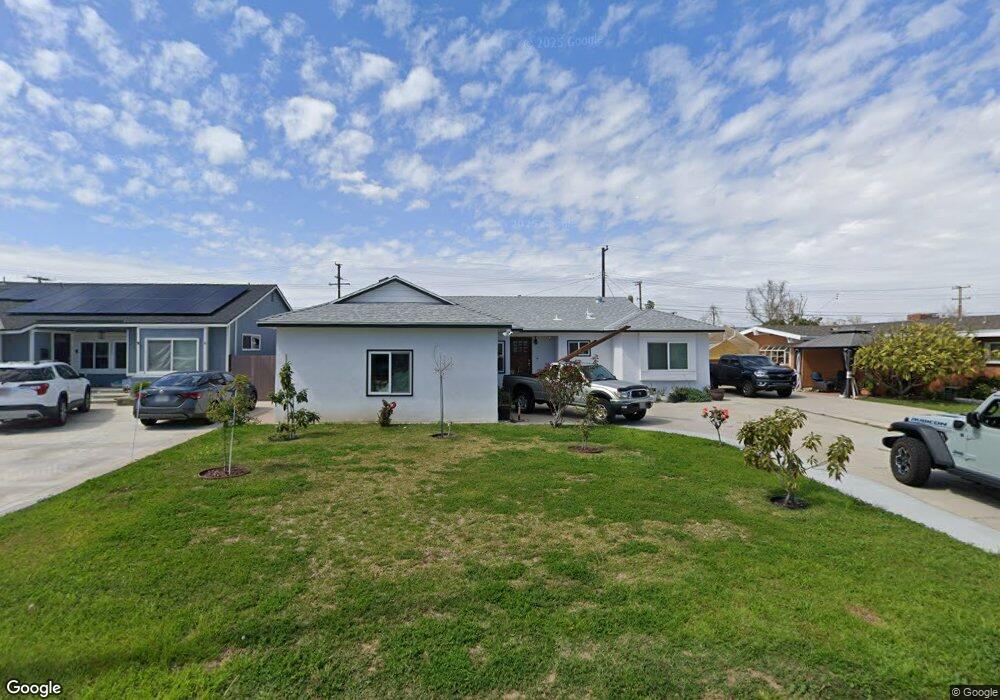
10943 Theis Ave Whittier, CA 90604
South Whittier NeighborhoodEstimated Value: $812,000 - $852,000
3
Beds
2
Baths
1,332
Sq Ft
$624/Sq Ft
Est. Value
About This Home
This home is located at 10943 Theis Ave, Whittier, CA 90604 and is currently estimated at $831,542, approximately $624 per square foot. 10943 Theis Ave is a home located in Los Angeles County with nearby schools including La Colima Elementary School, Granada Middle School, and California High School.
Ownership History
Date
Name
Owned For
Owner Type
Purchase Details
Closed on
Jul 24, 2014
Sold by
Doyle Shawn
Bought by
Doyle Rosalinda and Martin Rosalinda
Current Estimated Value
Purchase Details
Closed on
May 27, 2014
Sold by
Doyle Rosalinda
Bought by
Doyle Rosalinda and Rosalinda Doyle Separate Property Trust
Purchase Details
Closed on
Feb 5, 2002
Sold by
Ocon Eleuterio V and Martin Rosalinda
Bought by
Martin Rosalinda
Home Financials for this Owner
Home Financials are based on the most recent Mortgage that was taken out on this home.
Original Mortgage
$159,301
Outstanding Balance
$64,657
Interest Rate
6.8%
Estimated Equity
$766,885
Purchase Details
Closed on
Apr 26, 1995
Sold by
Martin Ronald
Bought by
Martin Rosalinda
Home Financials for this Owner
Home Financials are based on the most recent Mortgage that was taken out on this home.
Original Mortgage
$151,585
Interest Rate
7.92%
Mortgage Type
FHA
Create a Home Valuation Report for This Property
The Home Valuation Report is an in-depth analysis detailing your home's value as well as a comparison with similar homes in the area
Home Values in the Area
Average Home Value in this Area
Purchase History
| Date | Buyer | Sale Price | Title Company |
|---|---|---|---|
| Doyle Rosalinda | -- | None Available | |
| Doyle Rosalinda | -- | None Available | |
| Martin Rosalinda | -- | Fidelity National Title Ins | |
| Martin Rosalinda | -- | First American Title Co | |
| Ocon Eleuterio | $154,227 | First American Title Co |
Source: Public Records
Mortgage History
| Date | Status | Borrower | Loan Amount |
|---|---|---|---|
| Open | Martin Rosalinda | $159,301 | |
| Previous Owner | Ocon Eleuterio | $151,585 |
Source: Public Records
Tax History Compared to Growth
Tax History
| Year | Tax Paid | Tax Assessment Tax Assessment Total Assessment is a certain percentage of the fair market value that is determined by local assessors to be the total taxable value of land and additions on the property. | Land | Improvement |
|---|---|---|---|---|
| 2025 | $4,264 | $339,122 | $190,747 | $148,375 |
| 2024 | $4,264 | $332,473 | $187,007 | $145,466 |
| 2023 | $4,192 | $325,955 | $183,341 | $142,614 |
| 2022 | $4,102 | $319,565 | $179,747 | $139,818 |
| 2021 | $4,020 | $313,300 | $176,223 | $137,077 |
| 2019 | $3,939 | $304,010 | $170,998 | $133,012 |
| 2018 | $3,745 | $298,050 | $167,646 | $130,404 |
| 2016 | $3,230 | $258,718 | $161,137 | $97,581 |
| 2015 | $3,207 | $254,833 | $158,717 | $96,116 |
| 2014 | $3,166 | $249,842 | $155,608 | $94,234 |
Source: Public Records
Map
Nearby Homes
- 11111 Colima Rd
- 10855 Colima Rd
- 0 Telegraph Rd Unit DW24244539
- 14520 Mulberry Dr
- 10822 Colima Rd
- 11522 Double Eagle Dr
- 11134 Arroyo Dr
- 11502 Double Eagle Dr
- 10241 Ruoff Ave
- 14518 Rimgate Dr
- 14076 Cornishcrest Rd
- 11118 Bunker Ln
- 11102 Eagle Ln
- 10702 Colima Rd Unit 1005
- 11531 Sunnybrook Ln
- 11624 Starlight Ave
- 11813 Colima Rd
- 14865 Mulberry Dr Unit 1101
- 14146 Light St
- 10415 Valley View Ave
- 10949 Theis Ave
- 10937 Theis Ave
- 10926 Valley View Ave
- 11003 Theis Ave
- 10931 Theis Ave
- 10932 Valley View Ave
- 10920 Valley View Ave
- 10938 Valley View Ave
- 10914 Valley View Ave
- 10942 Theis Ave
- 10948 Theis Ave
- 10936 Theis Ave
- 11009 Theis Ave
- 10925 Theis Ave
- 11002 Theis Ave
- 10930 Theis Ave
- 10944 Valley View Ave
- 10908 Valley View Ave
- 11015 Theis Ave
- 10919 Theis Ave