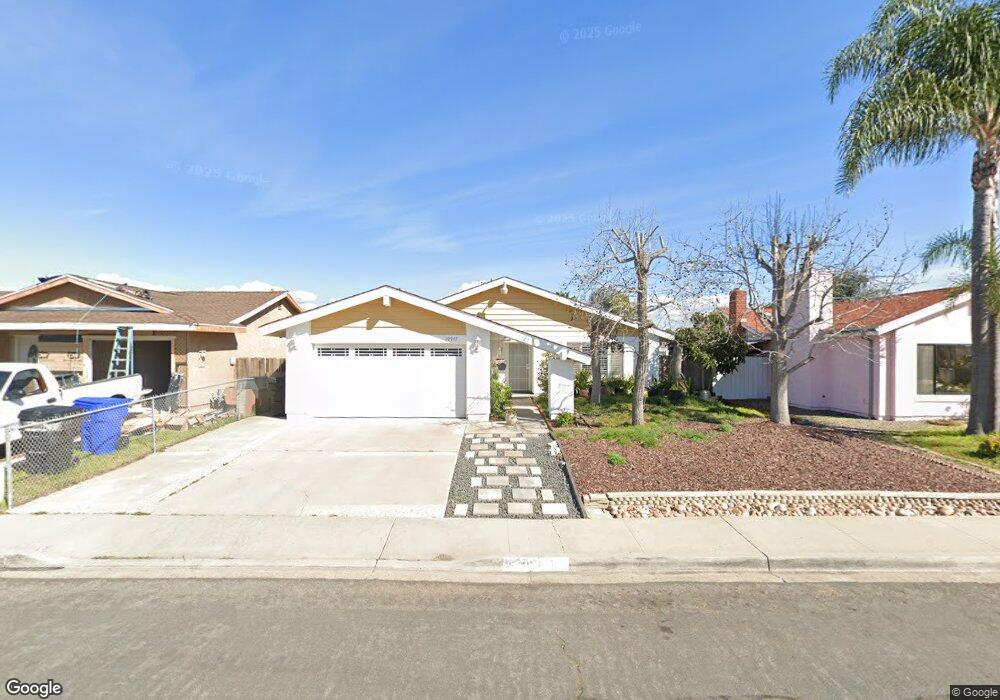
10947 Salinas Way San Diego, CA 92126
Mira Mesa NeighborhoodEstimated Value: $1,128,687 - $1,310,000
4
Beds
2
Baths
1,803
Sq Ft
$675/Sq Ft
Est. Value
About This Home
This home is located at 10947 Salinas Way, San Diego, CA 92126 and is currently estimated at $1,217,672, approximately $675 per square foot. 10947 Salinas Way is a home located in San Diego County with nearby schools including Hickman Elementary School, Challenger Middle School, and Mira Mesa High School.
Ownership History
Date
Name
Owned For
Owner Type
Purchase Details
Closed on
Sep 12, 2005
Sold by
Aniban Cesar M
Bought by
Aniban Cesar M and Aniban Kyoko
Current Estimated Value
Home Financials for this Owner
Home Financials are based on the most recent Mortgage that was taken out on this home.
Original Mortgage
$400,000
Outstanding Balance
$211,980
Interest Rate
5.7%
Mortgage Type
New Conventional
Estimated Equity
$1,005,692
Purchase Details
Closed on
Oct 22, 2003
Sold by
Aniban Cesar
Bought by
Aniban Cesar M and Aniban Kyoko
Purchase Details
Closed on
Jul 28, 2003
Sold by
Aniban Kyoko
Bought by
Aniban Cesar
Purchase Details
Closed on
Jun 26, 2003
Sold by
Waldrop Kenneth R and Waldrop Doris I
Bought by
Aniban Cesar
Create a Home Valuation Report for This Property
The Home Valuation Report is an in-depth analysis detailing your home's value as well as a comparison with similar homes in the area
Home Values in the Area
Average Home Value in this Area
Purchase History
| Date | Buyer | Sale Price | Title Company |
|---|---|---|---|
| Aniban Cesar M | -- | Diversified Title | |
| Aniban Cesar M | -- | Diversified Title & Escrow S | |
| Aniban Cesar M | -- | Orange Coast Title Company | |
| Aniban Cesar | -- | Commerce Title Company | |
| Aniban Cesar | $326,500 | Commerce Title Company |
Source: Public Records
Mortgage History
| Date | Status | Borrower | Loan Amount |
|---|---|---|---|
| Open | Aniban Cesar M | $400,000 |
Source: Public Records
Tax History Compared to Growth
Tax History
| Year | Tax Paid | Tax Assessment Tax Assessment Total Assessment is a certain percentage of the fair market value that is determined by local assessors to be the total taxable value of land and additions on the property. | Land | Improvement |
|---|---|---|---|---|
| 2025 | $5,872 | $490,506 | $341,222 | $149,284 |
| 2024 | $5,872 | $480,889 | $334,532 | $146,357 |
| 2023 | $5,741 | $471,461 | $327,973 | $143,488 |
| 2022 | $5,586 | $462,218 | $321,543 | $140,675 |
| 2021 | $5,545 | $453,156 | $315,239 | $137,917 |
| 2020 | $5,477 | $448,510 | $312,007 | $136,503 |
| 2019 | $5,378 | $439,717 | $305,890 | $133,827 |
| 2018 | $5,028 | $431,096 | $299,893 | $131,203 |
| 2017 | $80 | $422,644 | $294,013 | $128,631 |
| 2016 | $4,823 | $414,358 | $288,249 | $126,109 |
| 2015 | $4,751 | $408,135 | $283,920 | $124,215 |
| 2014 | $4,674 | $400,000 | $277,000 | $123,000 |
Source: Public Records
Map
Nearby Homes
- 7561 Windsong Rd
- 7736 Alcamo Rd
- 8007 New Salem St
- 10840 New Salem Point
- 7387 New Salem St
- 10840 Deering St
- 11149 Blythe Rd
- 10948 Worthing Ave
- 10692 Dabney Dr Unit 102
- 10668 Dabney Dr Unit 122
- 10668 Dabney Dr Unit 125
- 7646 Acama St
- 7636 Acama St
- 7684 Adkins Way
- 10774 Dabney Dr Unit 20
- 11545 Caminito la Bar Unit 74
- 10785 Chinon Cir
- 7385 Calle Cristobal Unit 225
- 10855 Camino Ruiz Unit 48
- 7944 Calico St
- 10943 Salinas Way
- 10951 Salinas Way
- 10952 Swansea Place
- 10955 Salinas Way
- 10939 Salinas Way
- 7780 Tripoli Rd
- 7811 Tampico Ct
- 10956 Swansea Place
- 7790 Tripoli Rd
- 10948 Salinas Way
- 10959 Salinas Way
- 10944 Salinas Way
- 10952 Salinas Way
- 10960 Swansea Place
- 10940 Salinas Way
- 7824 Tripoli Rd
- 7825 Tampico Ct
- 10963 Salinas Way
- 10960 Salinas Way
- 10964 Swansea Place