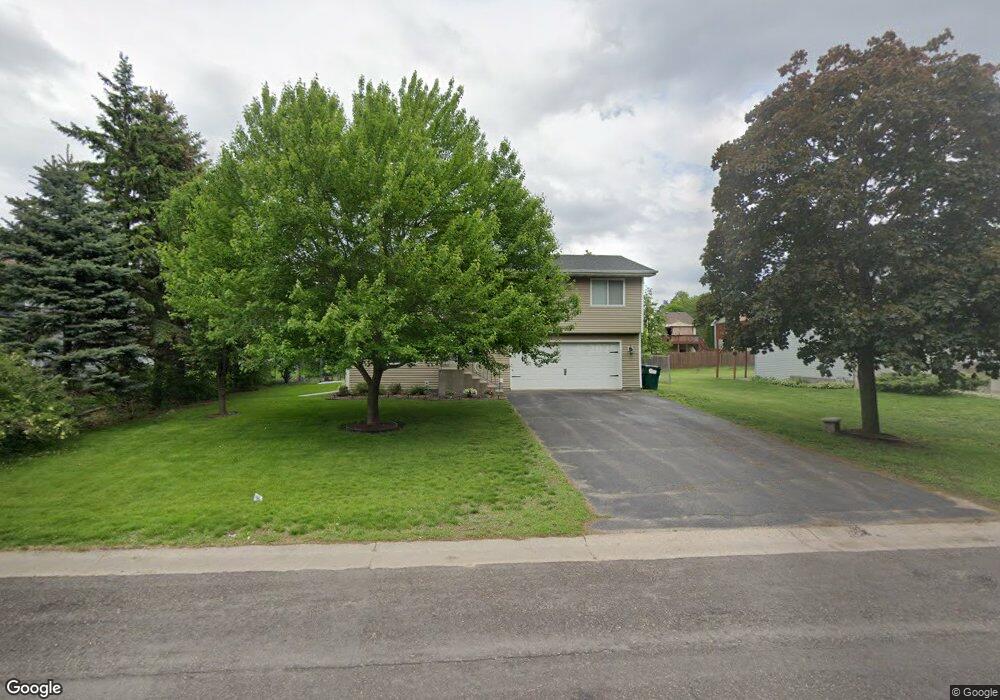
10949 Fillmore St NE Minneapolis, MN 55434
Estimated Value: $314,000 - $364,981
3
Beds
1
Bath
1,086
Sq Ft
$319/Sq Ft
Est. Value
About This Home
This home is located at 10949 Fillmore St NE, Minneapolis, MN 55434 and is currently estimated at $346,245, approximately $318 per square foot. 10949 Fillmore St NE is a home located in Anoka County with nearby schools including Jefferson Elementary School, Northdale Middle School, and Blaine Senior High School.
Ownership History
Date
Name
Owned For
Owner Type
Purchase Details
Closed on
Feb 3, 2016
Sold by
Allison Kathryn R
Bought by
Allison Kathryn and Allison Phillip
Current Estimated Value
Home Financials for this Owner
Home Financials are based on the most recent Mortgage that was taken out on this home.
Original Mortgage
$135,429
Outstanding Balance
$107,397
Interest Rate
3.79%
Estimated Equity
$238,848
Purchase Details
Closed on
Jul 28, 2009
Sold by
Bank Of New York Mellon
Bought by
Gallup Kathryn R
Home Financials for this Owner
Home Financials are based on the most recent Mortgage that was taken out on this home.
Original Mortgage
$147,184
Interest Rate
5.25%
Mortgage Type
FHA
Purchase Details
Closed on
May 26, 2000
Sold by
Garcia Alejandro J and Garcia Debra A
Bought by
Meyer Daniel J
Create a Home Valuation Report for This Property
The Home Valuation Report is an in-depth analysis detailing your home's value as well as a comparison with similar homes in the area
Home Values in the Area
Average Home Value in this Area
Purchase History
| Date | Buyer | Sale Price | Title Company |
|---|---|---|---|
| Allison Kathryn | -- | -- | |
| Gallup Kathryn R | $149,900 | -- | |
| Meyer Daniel J | $133,700 | -- |
Source: Public Records
Mortgage History
| Date | Status | Borrower | Loan Amount |
|---|---|---|---|
| Open | Allison Kathryn | $135,429 | |
| Closed | Allison Kathryn | -- | |
| Previous Owner | Gallup Kathryn R | $147,184 |
Source: Public Records
Tax History Compared to Growth
Tax History
| Year | Tax Paid | Tax Assessment Tax Assessment Total Assessment is a certain percentage of the fair market value that is determined by local assessors to be the total taxable value of land and additions on the property. | Land | Improvement |
|---|---|---|---|---|
| 2025 | $3,297 | $331,800 | $110,000 | $221,800 |
| 2024 | $3,297 | $321,000 | $108,200 | $212,800 |
| 2023 | $3,014 | $326,500 | $103,000 | $223,500 |
| 2022 | $2,639 | $319,900 | $90,000 | $229,900 |
| 2021 | $2,547 | $252,500 | $75,000 | $177,500 |
| 2020 | $2,567 | $239,300 | $75,000 | $164,300 |
| 2019 | $2,438 | $232,600 | $67,000 | $165,600 |
| 2018 | $2,367 | $217,500 | $0 | $0 |
| 2017 | $2,134 | $207,200 | $0 | $0 |
| 2016 | $2,392 | $188,000 | $0 | $0 |
| 2015 | $2,221 | $188,000 | $64,700 | $123,300 |
| 2014 | -- | $160,700 | $52,000 | $108,700 |
Source: Public Records
Map
Nearby Homes
- 1060 109th Ct NE
- 10753 Tyler Ct NE
- 10809 Tyler Ct NE
- 11038 Polk St NE
- 11213 Fillmore St NE
- 714 114th Ct NE
- 10721 Quincy Blvd NE
- 1481 111th Ln NE Unit G
- 11221 Aberdeen St NE Unit I
- 961 113th Ave NE
- 11365 Pierce St NE
- 11125 Baltimore St NE Unit L
- 866 113th Ln NE
- 1312 104th Place NE
- 11429 Pierce St NE
- 612 111th Ave NE
- 11358 Chisholm Cir NE Unit E
- 11132 Club West Cir Unit A
- 11119 Jefferson St NE
- 1348 104th Way
- 10961 Fillmore St NE
- 10968 Pierce St NE
- 10948 Fillmore St NE
- 10925 Fillmore St NE
- 10973 Fillmore St NE
- 10950 Pierce St NE
- 10986 Pierce St NE
- 10936 Fillmore St NE
- 10960 Fillmore St NE
- 10972 Fillmore St NE
- 10932 Pierce St NE
- 10924 Fillmore St NE
- 11004 Pierce St NE
- 10913 Fillmore St NE
- 11005 Fillmore St NE
- 10912 Fillmore St NE
- 11002 Fillmore St NE
- 11022 Pierce St NE
- 1089 109 Ct NE
- 1089 109th Ave NE