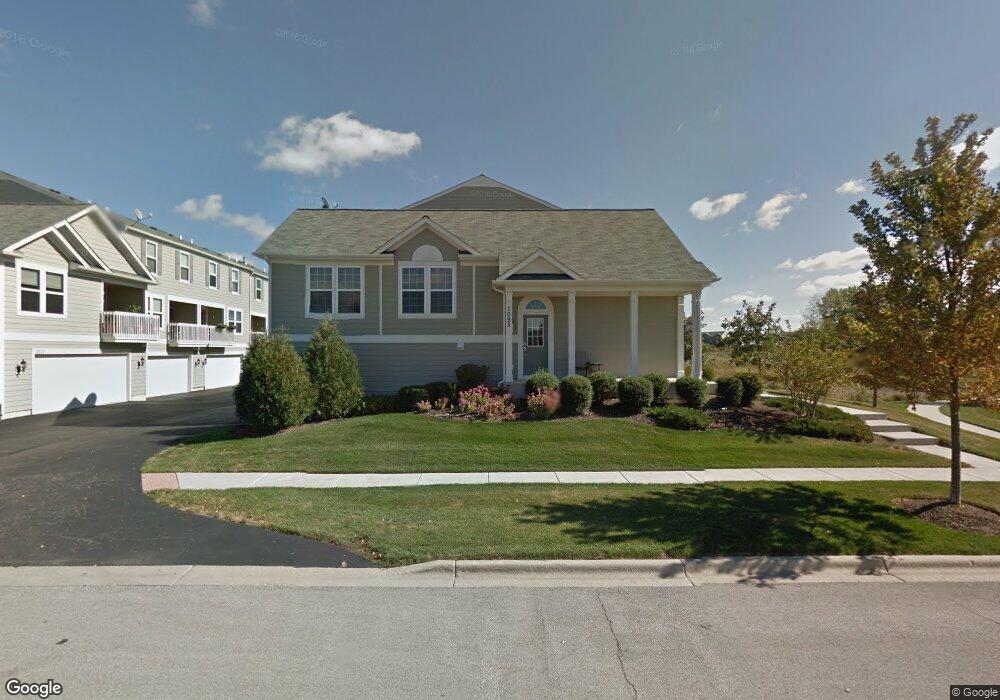
1095 Crane Pointe Rd Elgin, IL 60124
Providence NeighborhoodEstimated Value: $283,000 - $297,000
2
Beds
3
Baths
1,704
Sq Ft
$171/Sq Ft
Est. Value
About This Home
This home is located at 1095 Crane Pointe Rd, Elgin, IL 60124 and is currently estimated at $290,541, approximately $170 per square foot. 1095 Crane Pointe Rd is a home located in Kane County with nearby schools including Otter Creek Elementary School, Abbott Middle School, and South Elgin High School.
Ownership History
Date
Name
Owned For
Owner Type
Purchase Details
Closed on
Jun 8, 2017
Sold by
Lewandowski Mitchell J
Bought by
Rossi Michelle L
Current Estimated Value
Home Financials for this Owner
Home Financials are based on the most recent Mortgage that was taken out on this home.
Original Mortgage
$138,675
Outstanding Balance
$71,736
Interest Rate
3.62%
Mortgage Type
New Conventional
Estimated Equity
$218,805
Purchase Details
Closed on
Oct 31, 2016
Sold by
North James B
Bought by
Lewandowski Mitchell J and Hamilton Jessica
Purchase Details
Closed on
Jul 2, 2008
Sold by
North James B
Bought by
North James B and James B North Trust
Purchase Details
Closed on
Nov 20, 2007
Sold by
Pulte Home Corp
Bought by
North James B
Home Financials for this Owner
Home Financials are based on the most recent Mortgage that was taken out on this home.
Original Mortgage
$145,015
Interest Rate
6.33%
Mortgage Type
Purchase Money Mortgage
Create a Home Valuation Report for This Property
The Home Valuation Report is an in-depth analysis detailing your home's value as well as a comparison with similar homes in the area
Home Values in the Area
Average Home Value in this Area
Purchase History
| Date | Buyer | Sale Price | Title Company |
|---|---|---|---|
| Rossi Michelle L | $183,500 | Chicago Title Insurance Co | |
| Lewandowski Mitchell J | $125,000 | None Available | |
| North James B | -- | None Available | |
| North James B | $251,000 | Pulte Midwest Title South |
Source: Public Records
Mortgage History
| Date | Status | Borrower | Loan Amount |
|---|---|---|---|
| Open | Rossi Michelle L | $138,675 | |
| Previous Owner | North James B | $145,015 |
Source: Public Records
Tax History
| Year | Tax Paid | Tax Assessment Tax Assessment Total Assessment is a certain percentage of the fair market value that is determined by local assessors to be the total taxable value of land and additions on the property. | Land | Improvement |
|---|---|---|---|---|
| 2024 | $5,379 | $75,210 | $19,760 | $55,450 |
| 2023 | $5,110 | $67,947 | $17,852 | $50,095 |
| 2022 | $4,852 | $61,956 | $16,278 | $45,678 |
| 2021 | $4,633 | $57,925 | $15,219 | $42,706 |
| 2020 | $4,496 | $55,298 | $14,529 | $40,769 |
| 2019 | $4,359 | $52,675 | $13,840 | $38,835 |
| 2018 | $5,318 | $59,785 | $13,038 | $46,747 |
| 2017 | $5,813 | $56,519 | $12,326 | $44,193 |
| 2016 | $5,592 | $52,434 | $11,435 | $40,999 |
| 2015 | -- | $48,060 | $10,481 | $37,579 |
| 2014 | -- | $47,467 | $10,352 | $37,115 |
| 2013 | -- | $48,719 | $10,625 | $38,094 |
Source: Public Records
Map
Nearby Homes
- 1015 Reserve Dr
- 2490 Anna Way
- 1135 Reserve Dr
- 2419 Emily Ln
- 821 Red Barn Ln
- 2375 Cove Ct Unit 143D
- 1180 Delta Dr Unit 106A
- 1094 Delta Dr Unit 41A
- 647 Tuscan View
- 844 Voyage Way
- 938 Mesa Dr Unit 441D
- 2466 Amber Ln
- 2046 Mission Hills Dr
- 2487 Amber Ln
- 209 Nicole Dr Unit B
- 1475 Misthaven Ln
- 974 Annandale Dr
- 651 Lancaster Cir
- 593 Covered Bridge Dr
- 245 Nicole Dr Unit B
- 1093 Crane Point
- 1091 Crane Pointe Unit 1091
- 1089 Crane Point
- 1089 Crane Pointe
- 1073 Crane Point
- 1073 Crane Point Unit 482
- 1071 Crane Pointe Unit 481
- 1075 Crane Point Unit 483
- 1075 Crane Point
- 1087 Crane Point
- 1077 Crane Pointe
- 1085 Crane Point
- 1085 Crane Point Unit 471
- 1079 Crane Pointe
- 1081 Crane Point
- 1081 Crane Point Unit 486
- 1081 Crane Pointe
- 1067 Crane Pointe
- 1065 Crane Point
- 1063 Crane Point
Your Personal Tour Guide
Ask me questions while you tour the home.