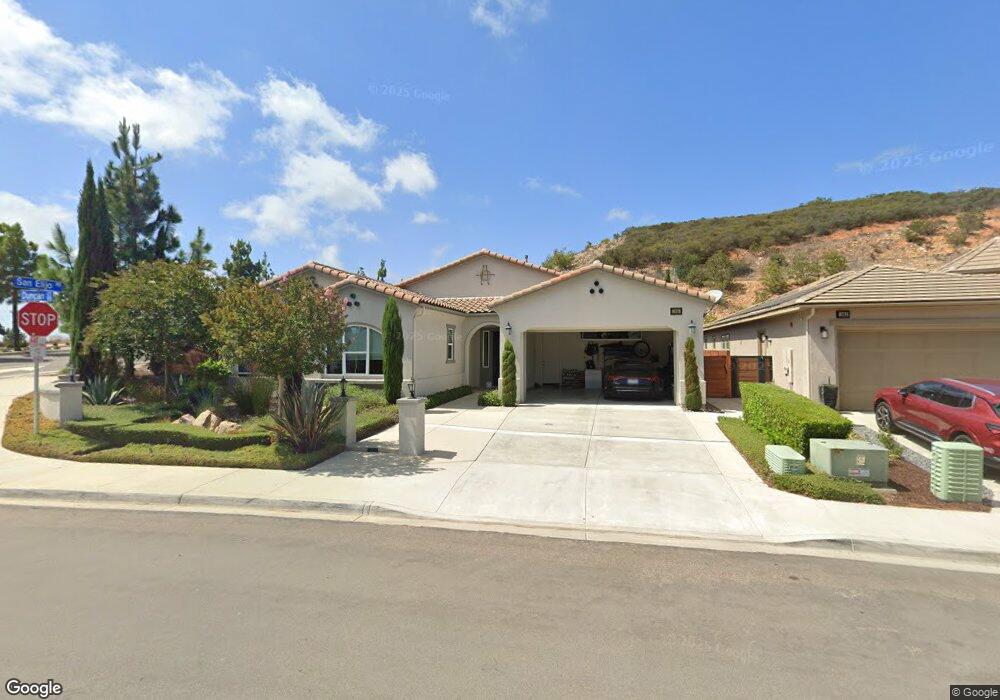
1095 Duncan Ct San Marcos, CA 92078
San Elijo NeighborhoodEstimated Value: $1,776,000 - $1,993,000
4
Beds
4
Baths
3,000
Sq Ft
$633/Sq Ft
Est. Value
About This Home
This home is located at 1095 Duncan Ct, San Marcos, CA 92078 and is currently estimated at $1,898,844, approximately $632 per square foot. 1095 Duncan Ct is a home located in San Diego County with nearby schools including Double Peak School, Mission Hills High School, and Baypoint Preparatory Academy - San Diego.
Ownership History
Date
Name
Owned For
Owner Type
Purchase Details
Closed on
Nov 9, 2016
Sold by
Richard American Homes Of Maryland Inc
Bought by
Safiedine Yehya M and Safiedine Rana
Current Estimated Value
Home Financials for this Owner
Home Financials are based on the most recent Mortgage that was taken out on this home.
Original Mortgage
$712,000
Outstanding Balance
$620,157
Interest Rate
6.5%
Mortgage Type
Adjustable Rate Mortgage/ARM
Estimated Equity
$1,278,687
Create a Home Valuation Report for This Property
The Home Valuation Report is an in-depth analysis detailing your home's value as well as a comparison with similar homes in the area
Home Values in the Area
Average Home Value in this Area
Purchase History
| Date | Buyer | Sale Price | Title Company |
|---|---|---|---|
| Safiedine Yehya M | $890,000 | First American Title Company |
Source: Public Records
Mortgage History
| Date | Status | Borrower | Loan Amount |
|---|---|---|---|
| Open | Safiedine Yehya M | $712,000 |
Source: Public Records
Tax History Compared to Growth
Tax History
| Year | Tax Paid | Tax Assessment Tax Assessment Total Assessment is a certain percentage of the fair market value that is determined by local assessors to be the total taxable value of land and additions on the property. | Land | Improvement |
|---|---|---|---|---|
| 2025 | $12,180 | $1,107,119 | $477,757 | $629,362 |
| 2024 | $12,180 | $1,085,412 | $468,390 | $617,022 |
| 2023 | $12,180 | $954,050 | $437,457 | $516,593 |
| 2022 | $10,988 | $954,050 | $437,457 | $516,593 |
| 2021 | $10,778 | $935,344 | $428,880 | $506,464 |
| 2020 | $10,686 | $925,754 | $424,483 | $501,271 |
| 2019 | $10,626 | $907,603 | $416,160 | $491,443 |
| 2018 | $10,355 | $889,807 | $408,000 | $481,807 |
| 2017 | $10,149 | $872,360 | $400,000 | $472,360 |
| 2016 | $5,132 | $406,100 | $406,100 | $0 |
| 2015 | $4,503 | $400,000 | $400,000 | $0 |
| 2014 | -- | $128,875 | $128,875 | $0 |
Source: Public Records
Map
Nearby Homes
- 0 Deadwood Dr Unit NDP2503517
- 402 Attebury Dr
- 0 Golden Eagle Trail Unit NDP2503140
- 630 Atherton St
- 892 Slate St
- 122 Diamante Rd
- 722 Gemstone Dr
- 701 Hatfield Dr
- 647 Hatfield Dr
- 489 Almond Rd
- 1789 Lemon Tree Ct
- 309 Bishop Dr
- 404 Almond Rd
- 935 Bridgeport Ct
- 1726 Blue Water Ln
- 802 Azalea Ave
- 0 Questhaven Rd Unit NDP2501375
- 923 Citrine Way
- 1110 Festival Rd
- 105 Trilogy St Unit 3