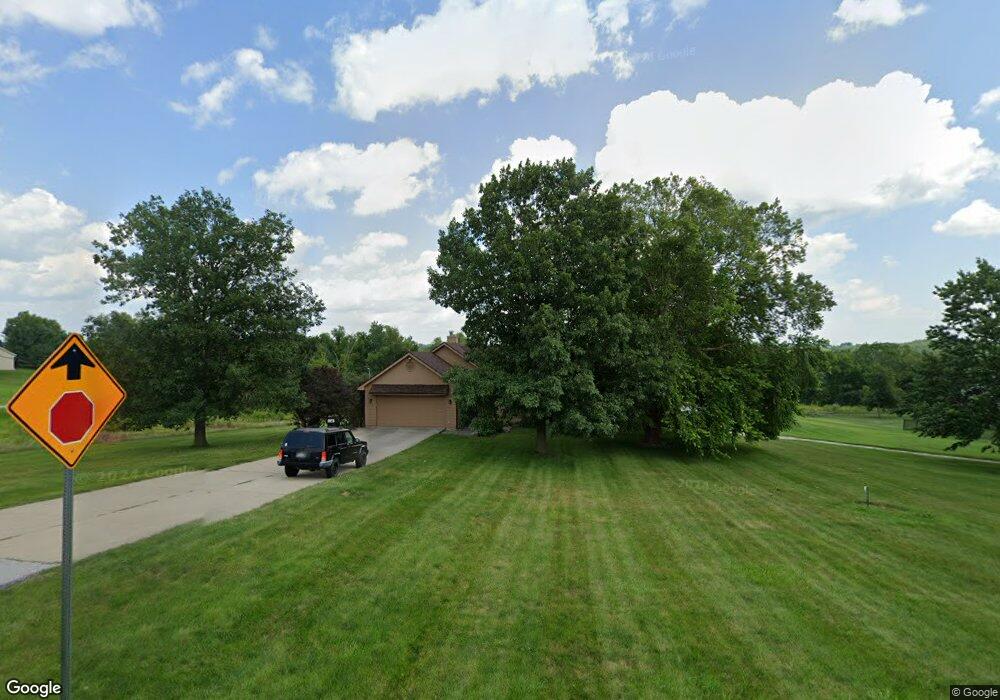
1095 SE 78th St Runnells, IA 50237
Estimated Value: $425,941 - $520,000
3
Beds
3
Baths
1,472
Sq Ft
$318/Sq Ft
Est. Value
About This Home
This home is located at 1095 SE 78th St, Runnells, IA 50237 and is currently estimated at $468,735, approximately $318 per square foot. 1095 SE 78th St is a home located in Polk County with nearby schools including Runnells Elementary School, Southeast Polk Spring Creek- 6th Grade, and Southeast Polk Junior High School.
Ownership History
Date
Name
Owned For
Owner Type
Purchase Details
Closed on
Aug 31, 2017
Sold by
Treft Bradnon and Treft Jillian
Bought by
Gogulamudi Satyanarayanareddy
Current Estimated Value
Purchase Details
Closed on
Mar 31, 2003
Sold by
Miller William C and Miller Maureen P
Bought by
Vannoy Lee C and Vannoy Mia Mueller
Home Financials for this Owner
Home Financials are based on the most recent Mortgage that was taken out on this home.
Original Mortgage
$176,800
Interest Rate
5.95%
Purchase Details
Closed on
Mar 25, 2003
Sold by
Nu Style Builders Inc
Bought by
Miller William C and Miller Maureen P
Home Financials for this Owner
Home Financials are based on the most recent Mortgage that was taken out on this home.
Original Mortgage
$176,800
Interest Rate
5.95%
Create a Home Valuation Report for This Property
The Home Valuation Report is an in-depth analysis detailing your home's value as well as a comparison with similar homes in the area
Home Values in the Area
Average Home Value in this Area
Purchase History
| Date | Buyer | Sale Price | Title Company |
|---|---|---|---|
| Gogulamudi Satyanarayanareddy | -- | -- | |
| Vannoy Lee C | $220,500 | -- | |
| Miller William C | -- | -- |
Source: Public Records
Mortgage History
| Date | Status | Borrower | Loan Amount |
|---|---|---|---|
| Previous Owner | Vannoy Lee C | $176,800 |
Source: Public Records
Tax History Compared to Growth
Tax History
| Year | Tax Paid | Tax Assessment Tax Assessment Total Assessment is a certain percentage of the fair market value that is determined by local assessors to be the total taxable value of land and additions on the property. | Land | Improvement |
|---|---|---|---|---|
| 2025 | $5,066 | $391,100 | $90,400 | $300,700 |
| 2024 | $5,066 | $357,300 | $81,400 | $275,900 |
| 2023 | $4,604 | $357,300 | $81,400 | $275,900 |
| 2022 | $4,548 | $274,200 | $64,900 | $209,300 |
| 2021 | $4,244 | $274,200 | $64,900 | $209,300 |
| 2020 | $4,180 | $243,600 | $57,300 | $186,300 |
| 2019 | $3,850 | $243,600 | $57,300 | $186,300 |
| 2018 | $3,870 | $216,100 | $49,400 | $166,700 |
| 2017 | $4,022 | $216,100 | $49,400 | $166,700 |
| 2016 | $4,020 | $201,900 | $45,200 | $156,700 |
| 2015 | $4,020 | $201,900 | $45,200 | $156,700 |
| 2014 | $4,518 | $221,300 | $49,100 | $172,200 |
Source: Public Records
Map
Nearby Homes
- 5792 Arbor Hills Ct
- 5736 Arbor Hills Ct
- 5766 Arbor Springs Dr
- 2511 SE 82nd St
- 2496 SE 83rd Ct
- 7046 SE 7th Ave
- 3356 SE 82nd St
- 7740 Spring Creek Dr
- 6922 SE 7th Ave
- 6918 SE 7th Ave
- 6806 SE 7th Ave
- 6802 SE 7th Ave
- 1200 Arbor Woods Dr
- 1230 Arbor Woods Dr
- 625 NE 72nd St
- 7295 SE Vandalia Dr
- 624 NE 71st St
- 702 NE 71st St
- 714 NE 71st St
- 726 NE 71st St
- 1155 SE 78th St
- 1205 SE 78th St
- 1108 SE 78th St
- 1058 SE 78th St
- 1162 SE 78th St
- 1002 SE 78th St
- 1245 SE 78th St
- 7857 SE 9th Ave
- 7845 SE 9th Ave
- 1228 SE 78th St
- 1013 SE 78th St
- 7885 SE 9th Ave
- 1279 SE 78th St
- 7868 SE 9th Ave
- 7846 SE 9th Ave
- 7915 SE 9th Ave
- 7741 SE 9th Ave
- 1321 SE 78th St
- 7935 SE 9th Ave
- 7916 SE 9th Ave