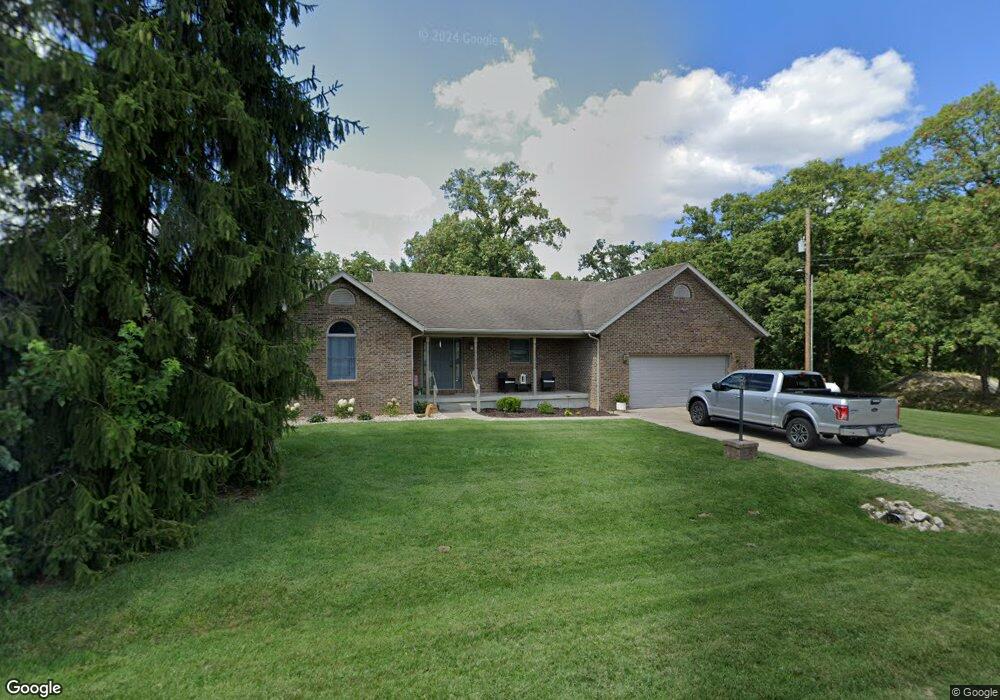
10950 Mulligan Ct Effingham, IL 62401
Estimated Value: $321,006 - $646,000
3
Beds
2
Baths
3,550
Sq Ft
$121/Sq Ft
Est. Value
About This Home
This home is located at 10950 Mulligan Ct, Effingham, IL 62401 and is currently estimated at $428,252, approximately $120 per square foot. 10950 Mulligan Ct is a home located in Effingham County with nearby schools including South Side Grade School, Early Learning Center, and Central Grade School.
Ownership History
Date
Name
Owned For
Owner Type
Purchase Details
Closed on
Dec 2, 2019
Sold by
Bilbo Skyler and Bilbo Lauren
Bought by
Koester Matthew
Current Estimated Value
Home Financials for this Owner
Home Financials are based on the most recent Mortgage that was taken out on this home.
Original Mortgage
$173,200
Outstanding Balance
$152,761
Interest Rate
3.62%
Mortgage Type
New Conventional
Estimated Equity
$275,491
Purchase Details
Closed on
May 19, 2015
Sold by
Pillers Darlene F and Pillers Robert H
Bought by
Bilbo Skyler
Home Financials for this Owner
Home Financials are based on the most recent Mortgage that was taken out on this home.
Original Mortgage
$156,000
Interest Rate
3.62%
Mortgage Type
New Conventional
Purchase Details
Closed on
Jul 25, 2005
Sold by
Pillers Robert H
Bought by
Pillers Robert H and Pillers Darlene F
Create a Home Valuation Report for This Property
The Home Valuation Report is an in-depth analysis detailing your home's value as well as a comparison with similar homes in the area
Home Values in the Area
Average Home Value in this Area
Purchase History
| Date | Buyer | Sale Price | Title Company |
|---|---|---|---|
| Koester Matthew | $266,000 | The Title Center | |
| Bilbo Skyler | $292,500 | None Available | |
| Pillers Robert H | -- | None Available |
Source: Public Records
Mortgage History
| Date | Status | Borrower | Loan Amount |
|---|---|---|---|
| Open | Koester Matthew | $173,200 | |
| Previous Owner | Bilbo Skyler | $156,000 |
Source: Public Records
Tax History Compared to Growth
Tax History
| Year | Tax Paid | Tax Assessment Tax Assessment Total Assessment is a certain percentage of the fair market value that is determined by local assessors to be the total taxable value of land and additions on the property. | Land | Improvement |
|---|---|---|---|---|
| 2024 | $4,885 | $97,250 | $6,860 | $90,390 |
| 2023 | $4,411 | $88,010 | $6,210 | $81,800 |
| 2022 | $4,146 | $81,490 | $5,750 | $75,740 |
| 2021 | $3,959 | $77,610 | $5,480 | $72,130 |
| 2020 | $3,811 | $74,630 | $5,270 | $69,360 |
| 2019 | $3,689 | $72,460 | $5,120 | $67,340 |
| 2018 | $3,529 | $69,010 | $4,880 | $64,130 |
| 2017 | $3,475 | $67,650 | $4,780 | $62,870 |
| 2016 | $3,345 | $64,730 | $4,570 | $60,160 |
| 2015 | -- | $64,080 | $4,520 | $59,560 |
| 2014 | -- | $63,450 | $4,480 | $58,970 |
| 2013 | -- | $63,450 | $4,480 | $58,970 |
| 2012 | -- | $63,450 | $4,480 | $58,970 |
Source: Public Records
Map
Nearby Homes
- 30 N Country Club Rd
- 12990 Country Club Rd
- 8 N Country Club Rd
- 9 N Country Club Rd
- 21 N Country Club Rd
- 13120 Augusta National Dr
- 24 N Country Club Rd
- 14342 Sportsman's Dr
- 14480 N 1025th St
- 14801 N Park Rd
- 14744 N Court 1
- 14704 N Court 1
- 1600 W Fayette Ave
- 15243 N Holden Ave
- 0 Augusta National Dr Unit 6255461
- Lot 3 N 1000th Rd
- 0 S Lakewood Dr
- 15095 N Nees Ln
- 710 W Richland Ave
- 601 S Maple St
- 10950 E Mulligan Dr
- 3 Mulligan Ct
- 12871 N Country Club Rd
- 10959 E Mulligan Dr
- 12826 N Country Club Rd
- 10911 E Mulligan Dr
- 10911 Mulligan Ct
- 12883 N Country Club Rd
- 12864 N Country Club Rd
- 10412 Country Club Rd Unit A
- 10940 E Country Club Dr
- 10930 E Country Club Dr
- 10930 Country Club Rd
- 12880 N Country Club Rd
- 10871 E Mulligan Dr
- 0 Country Club Rd Unit 6164988
- 0 Country Club Rd Unit MRD11598483
- 0 Country Club Rd Unit MRD11589643
- Lot 7 Country Club Rd
- 1000 Country Club Rd