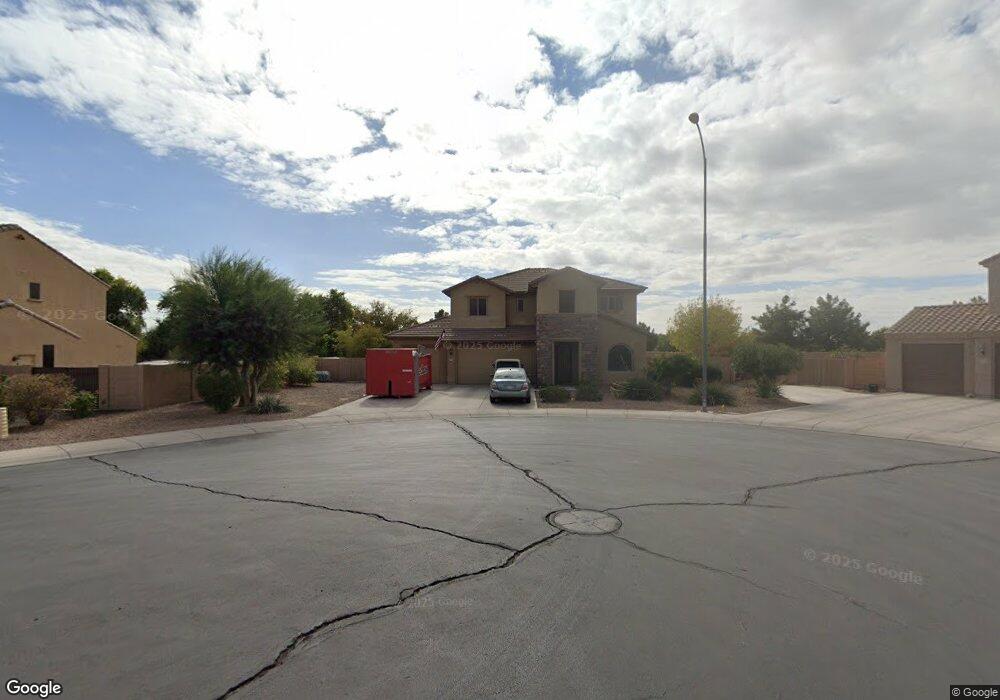
10955 E Quarry Cir Unit D Mesa, AZ 85212
Superstition Vistas NeighborhoodEstimated Value: $668,000 - $714,829
4
Beds
3
Baths
2,740
Sq Ft
$252/Sq Ft
Est. Value
About This Home
This home is located at 10955 E Quarry Cir Unit D, Mesa, AZ 85212 and is currently estimated at $691,457, approximately $252 per square foot. 10955 E Quarry Cir Unit D is a home located in Maricopa County with nearby schools including Desert Ridge Jr. High School, Desert Ridge High School, and Legacy Traditional School - East Mesa.
Ownership History
Date
Name
Owned For
Owner Type
Purchase Details
Closed on
Mar 3, 2011
Sold by
Blandford Homes Llc
Bought by
Weidner Alan W and Weidner Karen J
Current Estimated Value
Home Financials for this Owner
Home Financials are based on the most recent Mortgage that was taken out on this home.
Original Mortgage
$246,314
Outstanding Balance
$10,631
Interest Rate
3.75%
Mortgage Type
FHA
Estimated Equity
$680,826
Purchase Details
Closed on
Mar 2, 2011
Sold by
Pinnacle Ridge Holdings Llc
Bought by
Blandford Homes Llc
Home Financials for this Owner
Home Financials are based on the most recent Mortgage that was taken out on this home.
Original Mortgage
$246,314
Outstanding Balance
$10,631
Interest Rate
3.75%
Mortgage Type
FHA
Estimated Equity
$680,826
Purchase Details
Closed on
Aug 27, 2009
Sold by
Ehjp Property Holdings Llc
Bought by
Pinnacle Ridge Holdings Llc
Purchase Details
Closed on
Mar 12, 2009
Sold by
Porchlight Land & Cattle Llc
Bought by
Ehjp Property Holdings Llc
Create a Home Valuation Report for This Property
The Home Valuation Report is an in-depth analysis detailing your home's value as well as a comparison with similar homes in the area
Home Values in the Area
Average Home Value in this Area
Purchase History
| Date | Buyer | Sale Price | Title Company |
|---|---|---|---|
| Weidner Alan W | $252,722 | Old Republic Title Agency | |
| Blandford Homes Llc | -- | None Available | |
| Pinnacle Ridge Holdings Llc | $5,000,000 | None Available | |
| Ehjp Property Holdings Llc | $7,200,000 | First American Title |
Source: Public Records
Mortgage History
| Date | Status | Borrower | Loan Amount |
|---|---|---|---|
| Open | Weidner Alan W | $246,314 |
Source: Public Records
Tax History
| Year | Tax Paid | Tax Assessment Tax Assessment Total Assessment is a certain percentage of the fair market value that is determined by local assessors to be the total taxable value of land and additions on the property. | Land | Improvement |
|---|---|---|---|---|
| 2025 | $2,592 | $34,994 | -- | -- |
| 2024 | $2,515 | $33,327 | -- | -- |
| 2023 | $2,515 | $50,120 | $10,020 | $40,100 |
| 2022 | $2,454 | $39,470 | $7,890 | $31,580 |
| 2021 | $2,658 | $37,010 | $7,400 | $29,610 |
| 2020 | $2,611 | $34,080 | $6,810 | $27,270 |
| 2019 | $2,420 | $31,210 | $6,240 | $24,970 |
| 2018 | $2,304 | $29,610 | $5,920 | $23,690 |
| 2017 | $2,232 | $28,580 | $5,710 | $22,870 |
| 2016 | $2,303 | $28,410 | $5,680 | $22,730 |
| 2015 | $2,122 | $27,500 | $5,500 | $22,000 |
Source: Public Records
Map
Nearby Homes
- 10903 E Quade Ave
- 11223 E Raleigh Ave Unit 3
- 3529 S Tambor Unit 1
- 3549 S Oxley Cir
- 3541 S Calderon Cir
- 11250 E Prairie Ave
- 11430 E Pronghorn Ave Unit 3
- 11312 E Prairie Ave
- 3117 S Signal Butte Rd Unit 484
- 3117 S Signal Butte Rd Unit 540
- 3117 S Signal Butte Rd Unit 536
- 3117 S Signal Butte Rd Unit 514
- 11533 E Quicksilver Ave
- 11322 E Rembrandt Ave
- 11535 E Persimmon Ave
- 3041 S Lindenwood Cir
- 10830 E Ramona Ave
- 3061 S Elderwood
- 2949 S Berrywood
- 11208 E Ocaso Ave
- 10963 E Quarry Cir
- 10947 E Quarry Cir Unit D
- 11005 E Quarry Cir
- 10946 E Quarry Cir
- 11016 E Quade Ave
- 10954 E Quarry Cir Unit D
- 10962 E Quarry Cir
- 10966 E Quade Ave Unit D
- 11013 E Quarry Cir
- 11024 E Quade Ave Unit D
- 11004 E Quarry Cir
- 10958 E Quade Ave
- 11012 E Quarry Cir
- 10913 E Quarry Cir
- 11015 E Quade Ave
- 11007 E Quade Ave
- 10950 E Quade Ave
- 11020 E Quarry Ave
- 10905 E Quarry Cir Unit B
- 11023 E Quade Ave
Your Personal Tour Guide
Ask me questions while you tour the home.