10956 Hanson Blvd NW Coon Rapids, MN 55433
Estimated Value: $231,000 - $255,000
2
Beds
3
Baths
1,261
Sq Ft
$194/Sq Ft
Est. Value
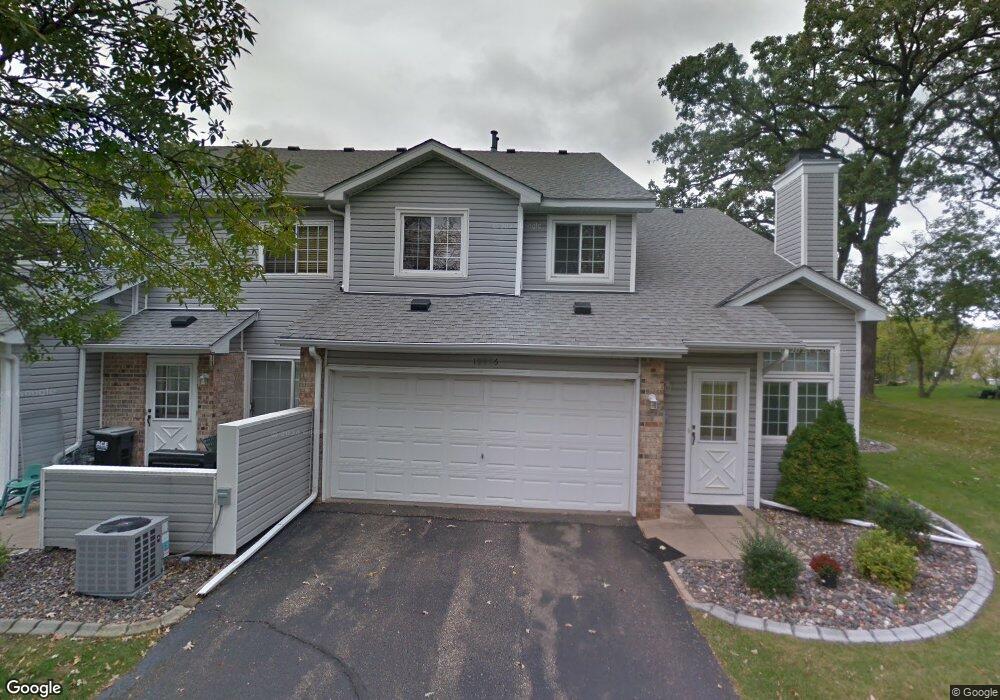
About This Home
This home is located at 10956 Hanson Blvd NW, Coon Rapids, MN 55433 and is currently estimated at $245,207, approximately $194 per square foot. 10956 Hanson Blvd NW is a home located in Anoka County with nearby schools including Lucile Bruner Elementary School, Hamilton Elementary School, and Laughlin Junior/Senior High School.
Ownership History
Date
Name
Owned For
Owner Type
Purchase Details
Closed on
Apr 6, 2016
Sold by
Quigley Karla M
Bought by
Powell Jonathan
Current Estimated Value
Home Financials for this Owner
Home Financials are based on the most recent Mortgage that was taken out on this home.
Original Mortgage
$101,600
Outstanding Balance
$80,556
Interest Rate
3.62%
Mortgage Type
New Conventional
Estimated Equity
$164,651
Purchase Details
Closed on
Jul 27, 2005
Sold by
Budde Paul J and Budde Kimberly A
Bought by
Quigley Karla M
Purchase Details
Closed on
Sep 26, 1997
Sold by
Ernst John A and Black Carol J
Bought by
Budde Paul J and Budde Kimberly A
Create a Home Valuation Report for This Property
The Home Valuation Report is an in-depth analysis detailing your home's value as well as a comparison with similar homes in the area
Home Values in the Area
Average Home Value in this Area
Purchase History
| Date | Buyer | Sale Price | Title Company |
|---|---|---|---|
| Powell Jonathan | $127,000 | Liberty Title Inc | |
| Quigley Karla M | $178,900 | -- | |
| Budde Paul J | $99,900 | -- |
Source: Public Records
Mortgage History
| Date | Status | Borrower | Loan Amount |
|---|---|---|---|
| Open | Powell Jonathan | $101,600 |
Source: Public Records
Tax History Compared to Growth
Tax History
| Year | Tax Paid | Tax Assessment Tax Assessment Total Assessment is a certain percentage of the fair market value that is determined by local assessors to be the total taxable value of land and additions on the property. | Land | Improvement |
|---|---|---|---|---|
| 2025 | $2,529 | $250,600 | $40,500 | $210,100 |
| 2024 | $2,529 | $251,700 | $46,800 | $204,900 |
| 2023 | $2,138 | $241,900 | $40,500 | $201,400 |
| 2022 | $2,186 | $228,300 | $31,500 | $196,800 |
| 2021 | $1,858 | $208,600 | $13,500 | $195,100 |
| 2020 | $1,909 | $177,300 | $18,000 | $159,300 |
| 2019 | $1,755 | $174,800 | $16,200 | $158,600 |
| 2018 | $1,679 | $158,500 | $0 | $0 |
| 2017 | $1,415 | $148,700 | $0 | $0 |
| 2016 | $1,436 | $125,600 | $0 | $0 |
| 2015 | $1,436 | $125,600 | $11,500 | $114,100 |
| 2014 | -- | $112,100 | $8,400 | $103,700 |
Source: Public Records
Map
Nearby Homes
- 11036 Hanson Blvd NW Unit 20
- 11000 Swallow St NW
- 2201 108th Ave NW
- 2400 108th Ave NW
- 10658 Hummingbird St NW
- 11409 Quinn St NW
- 11424 Hanson Blvd NW
- 10634 Hummingbird St NW
- 11350 Jay St NW
- 11444 Hanson Blvd NW
- 11361 Jay St NW
- 10648 Wren St NW
- 1900 Coon Rapids Blvd NW Unit 1
- 2001 103rd Ln NW
- 11267 Robinson Dr NW
- 2721 109th Ave NW
- 10616 Arrowhead St NW
- 10239 Raven St NW
- 2728 109th Ln NW
- 1660 Northdale Blvd NW
- 10958 Hanson Blvd NW
- 10952 Hanson Blvd NW
- 10954 Hanson Blvd NW
- 10948 Hanson Blvd NW Unit 25
- 10950 Hanson Blvd NW
- 10944 Hanson Blvd NW
- 10946 Hanson Blvd NW Unit 28
- 10984 Hanson Blvd NW
- 10942 Hanson Blvd NW Unit 30
- 10940 Hanson Blvd NW
- 10974 Hanson Blvd NW Unit 38
- 10978 Hanson Blvd NW
- 10976 Hanson Blvd NW Unit 35
- 10978 Hanson Blvd NW Unit 36
- 10980 Hanson Blvd NW
- 10980 Hanson Blvd NW Unit 33
- 10938 Hanson Blvd NW
- 10982 Hanson Blvd NW
- 10972 Hanson Blvd NW Unit 37
- 10968 Hanson Blvd NW