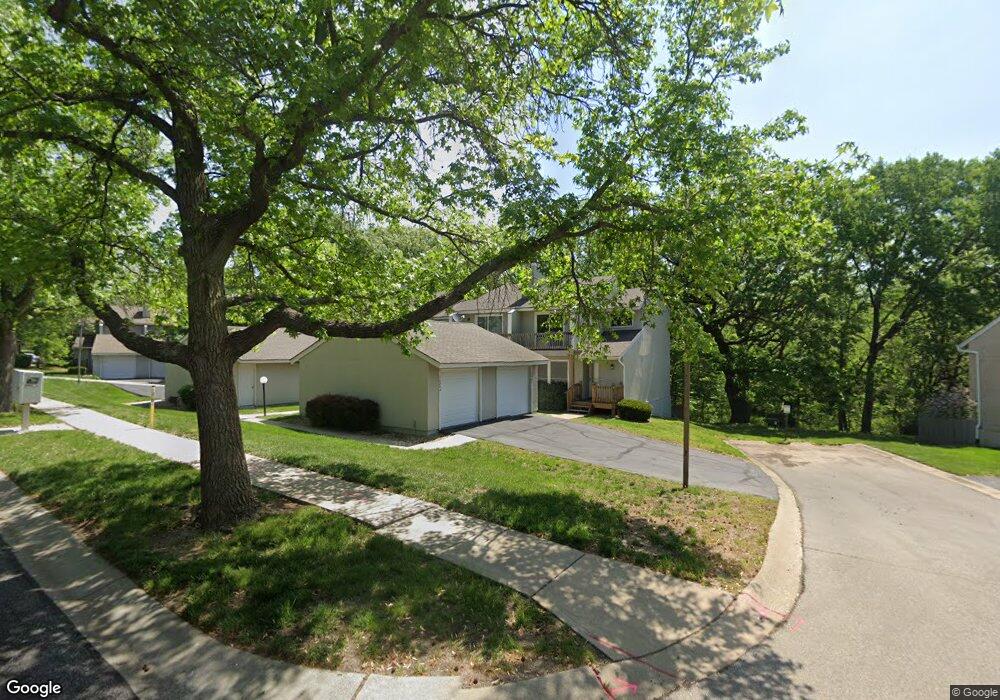
10959 Westgate Rd Overland Park, KS 66210
Central Overland Park NeighborhoodEstimated Value: $218,000 - $262,000
2
Beds
2
Baths
1,116
Sq Ft
$218/Sq Ft
Est. Value
About This Home
This home is located at 10959 Westgate Rd, Overland Park, KS 66210 and is currently estimated at $243,000, approximately $217 per square foot. 10959 Westgate Rd is a home located in Johnson County with nearby schools including Walnut Grove Elementary School, Pioneer Trail Middle School, and Olathe East Sr High School.
Ownership History
Date
Name
Owned For
Owner Type
Purchase Details
Closed on
Nov 28, 2023
Sold by
Fredriksen Rolf and Fredriksen Jeanne
Bought by
Ford Melanie
Current Estimated Value
Purchase Details
Closed on
Sep 23, 2009
Sold by
Ogrady Keeley J and Ogrady Michael W
Bought by
Fredriksen Rolf and Fredriksen Jeanne
Home Financials for this Owner
Home Financials are based on the most recent Mortgage that was taken out on this home.
Original Mortgage
$101,175
Interest Rate
5.36%
Mortgage Type
New Conventional
Purchase Details
Closed on
Sep 21, 2009
Sold by
Ogrady Roselyn
Bought by
Ogrady Keeley J and Ogrady Michael W
Home Financials for this Owner
Home Financials are based on the most recent Mortgage that was taken out on this home.
Original Mortgage
$101,175
Interest Rate
5.36%
Mortgage Type
New Conventional
Purchase Details
Closed on
Jun 30, 2003
Sold by
Loveall Robert R and Loveall Victoria A
Bought by
Ogrady Keeley J and Ogrady Michael W
Home Financials for this Owner
Home Financials are based on the most recent Mortgage that was taken out on this home.
Original Mortgage
$87,600
Interest Rate
5.23%
Mortgage Type
Purchase Money Mortgage
Create a Home Valuation Report for This Property
The Home Valuation Report is an in-depth analysis detailing your home's value as well as a comparison with similar homes in the area
Home Values in the Area
Average Home Value in this Area
Purchase History
| Date | Buyer | Sale Price | Title Company |
|---|---|---|---|
| Ford Melanie | -- | Continental Title Company | |
| Fredriksen Rolf | -- | Chicago Title Insurance Co | |
| Ogrady Keeley J | -- | Chicago Title Insurance Co | |
| Ogrady Keeley J | -- | Chicago Title Insurance Co |
Source: Public Records
Mortgage History
| Date | Status | Borrower | Loan Amount |
|---|---|---|---|
| Previous Owner | Fredriksen Rolf | $101,175 | |
| Previous Owner | Ogrady Keeley J | $87,600 | |
| Closed | Ogrady Keeley J | $21,900 |
Source: Public Records
Tax History Compared to Growth
Tax History
| Year | Tax Paid | Tax Assessment Tax Assessment Total Assessment is a certain percentage of the fair market value that is determined by local assessors to be the total taxable value of land and additions on the property. | Land | Improvement |
|---|---|---|---|---|
| 2024 | $2,561 | $24,150 | $3,542 | $20,608 |
| 2023 | $2,352 | $21,517 | $3,542 | $17,975 |
| 2022 | $2,241 | $20,068 | $2,956 | $17,112 |
| 2021 | $2,241 | $16,514 | $2,366 | $14,148 |
| 2020 | $1,814 | $15,330 | $2,366 | $12,964 |
| 2019 | $1,860 | $15,594 | $2,366 | $13,228 |
| 2018 | $1,679 | $13,985 | $2,151 | $11,834 |
| 2017 | $1,590 | $13,156 | $1,955 | $11,201 |
| 2016 | $1,431 | $12,144 | $1,955 | $10,189 |
| 2015 | $1,412 | $12,133 | $1,955 | $10,178 |
| 2013 | -- | $10,994 | $1,955 | $9,039 |
Source: Public Records
Map
Nearby Homes
- 10997 Rosehill Rd
- 10863 Rosehill Rd
- 10981 Rosehill Rd
- 10853 Rosehill Rd
- 12696 W 108th Terrace
- 12707 W 108th Terrace
- 12618 W 110th Terrace
- 12782 W 108th Terrace
- 12641 W 110th Terrace
- 10901 Gillette St
- 12623 W 110th Terrace
- 12653 W 110th Terrace
- 12659 W 110th Terrace
- 10951 Gillette St
- 10909 Gillette St
- 10989 Gillette St
- 12946 W 110th St
- 12808 W 108th St
- 12786 W 110th Terrace
- 10561 Long St
- 10961 Westgate Rd
- 10957 Westgate Rd
- 10959 Westgate St
- 10955 Westgate Rd
- 10963 Westgate Rd
- 10965 Westgate Rd
- 10965 Westgate St
- 10967 Westgate Rd
- 10969 Westgate Rd
- 12607 W 109th St
- 10953 Westgate Rd
- 10999 Rosehill Rd
- 10953 Westgate Rd
- 10951 Westgate Rd
- 10951 Westgate Rd
- 12603 W 109th St
- 12609 W 109th St
- 10998 Rosehill Rd
- 12601 W 109th St
- 10995 Rosehill Rd