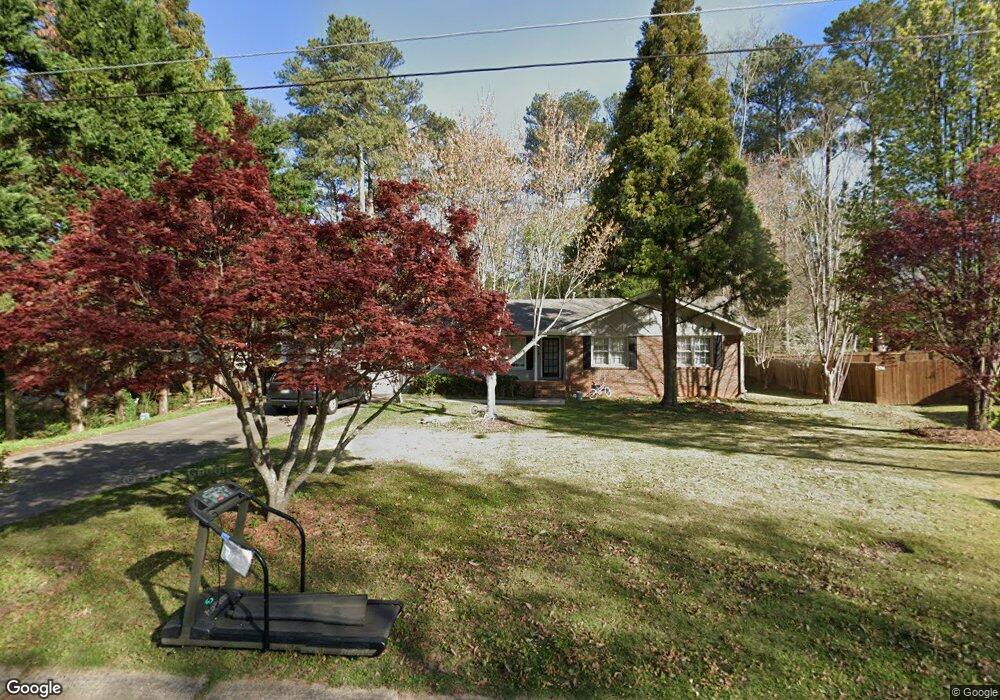
1096 Mccormick Way SW Marietta, GA 30008
Southwestern Marietta NeighborhoodEstimated Value: $337,000 - $373,000
3
Beds
2
Baths
1,418
Sq Ft
$251/Sq Ft
Est. Value
About This Home
This home is located at 1096 Mccormick Way SW, Marietta, GA 30008 and is currently estimated at $355,448, approximately $250 per square foot. 1096 Mccormick Way SW is a home located in Cobb County with nearby schools including Cheatham Hill Elementary School, Smitha Middle School, and Osborne High School.
Ownership History
Date
Name
Owned For
Owner Type
Purchase Details
Closed on
Nov 17, 2016
Sold by
Dong Duyen T
Bought by
Dong Xuannuong Thi
Current Estimated Value
Purchase Details
Closed on
Oct 10, 2014
Sold by
Phan Nancy Maritza
Bought by
Dong Duyen T
Purchase Details
Closed on
Aug 25, 2011
Sold by
Phan Nancy Maritza
Bought by
Phan Nancy Maritza and Phan Loi Van
Purchase Details
Closed on
Jun 27, 2011
Sold by
Hud-Housing Of Urban Dev
Bought by
Phan Nancy M
Purchase Details
Closed on
Sep 7, 2010
Sold by
Wells Fargo Bk Na
Bought by
Hud-Housing Of Urban Dev
Purchase Details
Closed on
Jun 29, 2000
Sold by
Thompson Joseph C and Thompson Terri S
Bought by
Mathis Helen J
Home Financials for this Owner
Home Financials are based on the most recent Mortgage that was taken out on this home.
Original Mortgage
$135,709
Interest Rate
8.63%
Mortgage Type
FHA
Create a Home Valuation Report for This Property
The Home Valuation Report is an in-depth analysis detailing your home's value as well as a comparison with similar homes in the area
Home Values in the Area
Average Home Value in this Area
Purchase History
| Date | Buyer | Sale Price | Title Company |
|---|---|---|---|
| Dong Xuannuong Thi | -- | -- | |
| Dong Duyen T | -- | -- | |
| Phan Nancy Maritza | -- | -- | |
| Phan Nancy M | -- | -- | |
| Hud-Housing Of Urban Dev | -- | -- | |
| Wells Fargo Bk Na | $137,318 | -- | |
| Mathis Helen J | $137,500 | -- |
Source: Public Records
Mortgage History
| Date | Status | Borrower | Loan Amount |
|---|---|---|---|
| Previous Owner | Mathis Helen J | $135,709 |
Source: Public Records
Tax History Compared to Growth
Tax History
| Year | Tax Paid | Tax Assessment Tax Assessment Total Assessment is a certain percentage of the fair market value that is determined by local assessors to be the total taxable value of land and additions on the property. | Land | Improvement |
|---|---|---|---|---|
| 2025 | $4,028 | $133,688 | $34,000 | $99,688 |
| 2024 | $4,031 | $133,688 | $34,000 | $99,688 |
| 2023 | $4,031 | $133,688 | $34,000 | $99,688 |
| 2022 | $2,605 | $85,816 | $28,000 | $57,816 |
| 2021 | $2,605 | $85,816 | $28,000 | $57,816 |
| 2020 | $2,362 | $77,816 | $20,000 | $57,816 |
| 2019 | $2,105 | $69,368 | $16,000 | $53,368 |
| 2018 | $2,105 | $69,368 | $16,000 | $53,368 |
| 2017 | $1,794 | $62,408 | $16,000 | $46,408 |
| 2016 | $1,697 | $59,012 | $12,400 | $46,612 |
| 2015 | $1,739 | $59,012 | $12,400 | $46,612 |
| 2014 | $537 | $18,072 | $0 | $0 |
Source: Public Records
Map
Nearby Homes
- 1704 Sterling Trail SW
- 1589 Hammond Woods Cir SW
- 1759 Kimberly Dr SW
- 1799 Hammond Woods Cir SW
- 1224 Murray Cir SW
- 891 Scott Ln SW
- 1784 Hammond Woods Cir SW
- 927 Crestmanor Dr
- 1665 Cunningham Rd SW
- 744 Evelyn Ln
- 691 Crosswinds Cir
- 1010 Wesley Park Dr SW
- 1472 Chapel Hill Ln SW
- 650 Lowell Dr SW
- 1382 Old Coach Rd SW
- 745 Cedar Pointe Ct SW
- 1315 Old Coach Rd SW
- 1110 Mccormick Way SW
- 1734 Kimberly Dr SW
- 1732 Kimberly Dr SW
- 1116 Mccormick Way SW
- 250252 Kimberly Way SW
- 1836 Kimberly Dr SW
- 1730 Kimberly Dr SW
- 1838 Kimberly Dr SW Unit 1
- 1095 Mccormick Way SW
- 1075 Mccormick Way SW
- 1832 Kimberly Dr SW
- 1119 Mccormick Way SW
- 1728 Kimberly Dr SW
- 0 Mccormick Way SW Unit 3241935
- 0 Mccormick Way SW Unit 7069493
- 0 Mccormick Way SW Unit 8178499
- 0 Mccormick Way SW
- 1830 Kimberly Dr SW
- 1733 Kimberly Dr SW
- 1840 Kimberly Dr SW