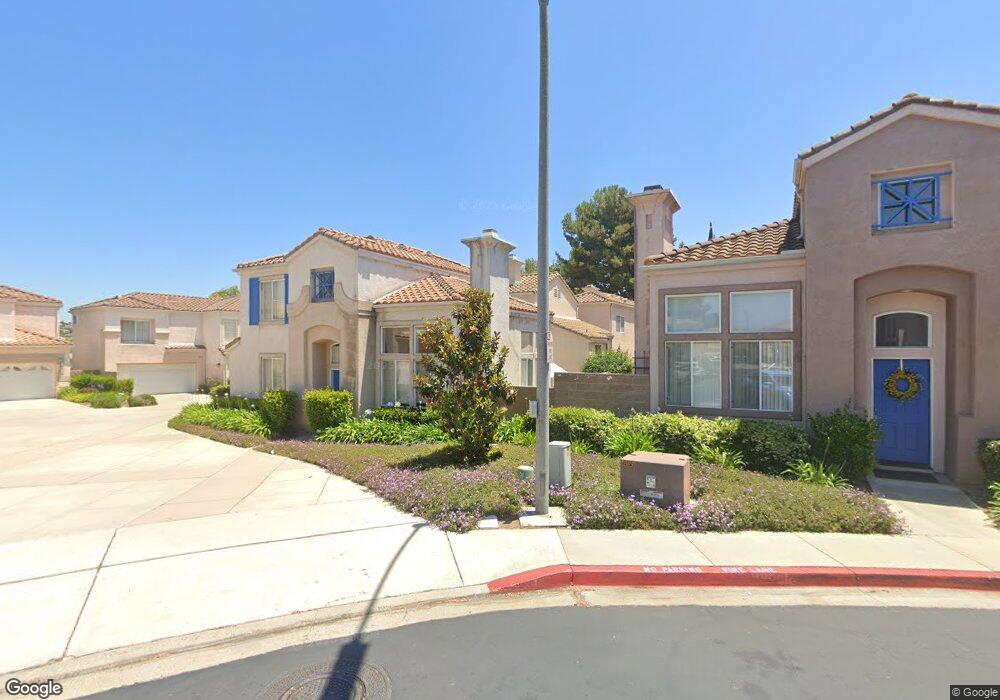
10960 Caminito Arcada Unit 184 San Diego, CA 92131
Miramar Ranch North NeighborhoodEstimated Value: $887,460 - $992,000
3
Beds
3
Baths
1,216
Sq Ft
$776/Sq Ft
Est. Value
About This Home
This home is located at 10960 Caminito Arcada Unit 184, San Diego, CA 92131 and is currently estimated at $943,865, approximately $776 per square foot. 10960 Caminito Arcada Unit 184 is a home located in San Diego County with nearby schools including Dingeman Elementary School, Thurgood Marshall Middle School, and Scripps Ranch High School.
Ownership History
Date
Name
Owned For
Owner Type
Purchase Details
Closed on
May 3, 2002
Sold by
Mcclellan Scott A and Mcclellan Lisa W
Bought by
Fung Tony
Current Estimated Value
Home Financials for this Owner
Home Financials are based on the most recent Mortgage that was taken out on this home.
Original Mortgage
$275,360
Outstanding Balance
$116,356
Interest Rate
6.94%
Estimated Equity
$827,509
Purchase Details
Closed on
Oct 28, 1998
Sold by
Sellers Scott T and Sorg Teresa L
Bought by
Mcclellan Scott A and Mcclellan Lisa W
Home Financials for this Owner
Home Financials are based on the most recent Mortgage that was taken out on this home.
Original Mortgage
$189,000
Interest Rate
6.69%
Mortgage Type
VA
Purchase Details
Closed on
Jun 20, 1997
Sold by
Encore Scripps Ranch Lp
Bought by
Sellers Scott T and Sorg Teresa L
Home Financials for this Owner
Home Financials are based on the most recent Mortgage that was taken out on this home.
Original Mortgage
$143,057
Interest Rate
7.58%
Mortgage Type
VA
Create a Home Valuation Report for This Property
The Home Valuation Report is an in-depth analysis detailing your home's value as well as a comparison with similar homes in the area
Home Values in the Area
Average Home Value in this Area
Purchase History
| Date | Buyer | Sale Price | Title Company |
|---|---|---|---|
| Fung Tony | $344,500 | California Title Company | |
| Mcclellan Scott A | $199,000 | Commonwealth Land Title Co | |
| Sellers Scott T | $161,090 | First American Title |
Source: Public Records
Mortgage History
| Date | Status | Borrower | Loan Amount |
|---|---|---|---|
| Open | Fung Tony | $275,360 | |
| Previous Owner | Mcclellan Scott A | $189,000 | |
| Previous Owner | Sellers Scott T | $143,057 |
Source: Public Records
Tax History Compared to Growth
Tax History
| Year | Tax Paid | Tax Assessment Tax Assessment Total Assessment is a certain percentage of the fair market value that is determined by local assessors to be the total taxable value of land and additions on the property. | Land | Improvement |
|---|---|---|---|---|
| 2025 | $6,336 | $508,473 | $132,951 | $375,522 |
| 2024 | $6,336 | $498,504 | $130,345 | $368,159 |
| 2023 | $6,188 | $488,731 | $127,790 | $360,941 |
| 2022 | $5,978 | $479,149 | $125,285 | $353,864 |
| 2021 | $5,927 | $469,755 | $122,829 | $346,926 |
| 2020 | $5,857 | $464,939 | $121,570 | $343,369 |
| 2019 | $5,940 | $455,824 | $119,187 | $336,637 |
| 2018 | $6,008 | $446,887 | $116,850 | $330,037 |
| 2017 | $80 | $438,125 | $114,559 | $323,566 |
| 2016 | $5,809 | $429,535 | $112,313 | $317,222 |
| 2015 | $5,734 | $423,084 | $110,626 | $312,458 |
| 2014 | $5,650 | $414,797 | $108,459 | $306,338 |
Source: Public Records
Map
Nearby Homes
- 10818 Caminito Arcada
- 10941 Waterton Rd
- 10914 Ivy Hill Dr Unit 1
- 11629 Swan Lake Dr Unit 4
- 11466 Tree Hollow Ln
- 12490 Heatherton Ct Unit 8
- 11793 Alderhill Terrace
- 11121 Catarina Ln Unit 73
- 10978 Serafina Ln Unit 69
- 12665 Creekview Dr Unit 140
- 12626 Springbrook Dr Unit A
- 12662 Springbrook Dr Unit D
- 12670 Springbrook Dr Unit D
- 12676 Springbrook Dr Unit B
- 11482 Cortina Place
- 10804 Serafina Ln Unit 6
- 11365 Affinity Ct Unit 192
- 11553 Trailbrook Ln Unit 2
- 11825 Miro Cir
- 11856 Miro Cir
- 10962 Caminito Arcada
- 10952 Caminito Arcada
- 10954 Caminito Arcada Unit 181
- 10958 Caminito Arcada
- 10950 Caminito Arcada Unit 179
- 10956 Caminito Arcada
- 10946 Caminito Arcada
- 10968 Caminito Arcada Unit RP188
- 10948 Caminito Arcada
- 10964 Caminito Arcada
- 10944 Caminito Arcada Unit 176
- 10974 Caminito Arcada
- 10972 Caminito Arcada
- 10970 Caminito Arcada
- 10966 Caminito Arcada
- 11071 Caminito Arcada Unit 222
- 10924 Caminito Arcada
- 11073 Caminito Arcada
- 10976 Caminito Arcada
- 11742 Petenwell Rd Unit 5