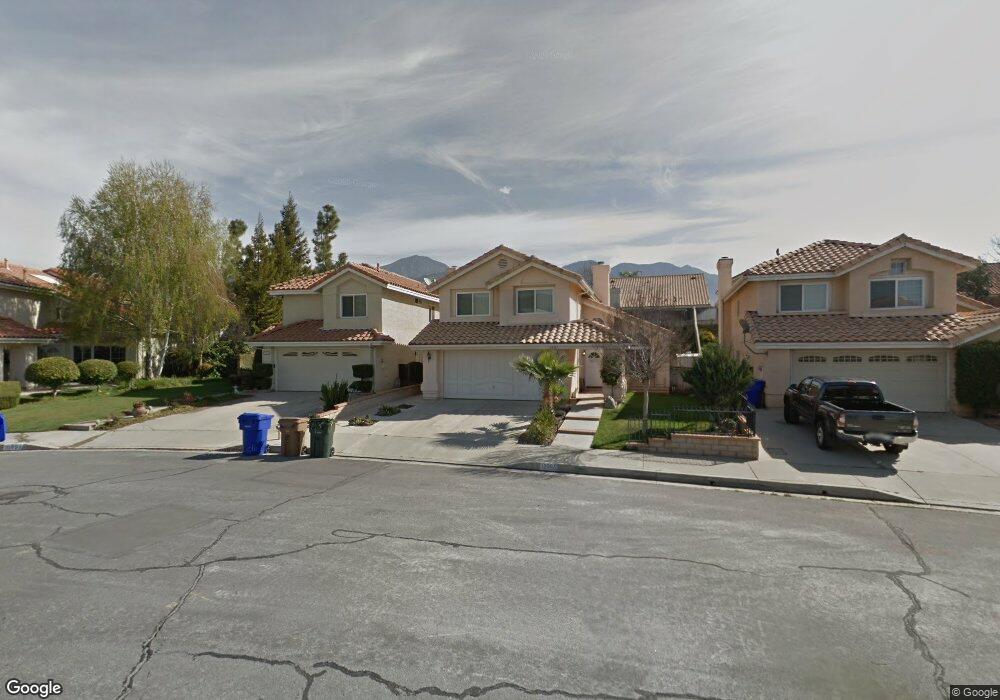
10967 Laurel Grove Cir Yucaipa, CA 92399
Upper Yucaipa-Rolling Hills NeighborhoodEstimated Value: $516,764 - $551,000
3
Beds
3
Baths
1,659
Sq Ft
$323/Sq Ft
Est. Value
About This Home
This home is located at 10967 Laurel Grove Cir, Yucaipa, CA 92399 and is currently estimated at $535,941, approximately $323 per square foot. 10967 Laurel Grove Cir is a home located in San Bernardino County with nearby schools including Ridgeview Elementary School, Park View Middle School, and Yucaipa High School.
Ownership History
Date
Name
Owned For
Owner Type
Purchase Details
Closed on
Mar 18, 2010
Sold by
Miller Daniel J and Miller Nancy J
Bought by
Cruz Pedro and Ornelas Sandra
Current Estimated Value
Home Financials for this Owner
Home Financials are based on the most recent Mortgage that was taken out on this home.
Original Mortgage
$216,015
Interest Rate
5.5%
Mortgage Type
FHA
Purchase Details
Closed on
Nov 28, 2006
Sold by
Weiler Woodrow P
Bought by
Miller Daniel J and Miller Nancy J
Home Financials for this Owner
Home Financials are based on the most recent Mortgage that was taken out on this home.
Original Mortgage
$293,600
Interest Rate
6.32%
Mortgage Type
Purchase Money Mortgage
Purchase Details
Closed on
Mar 12, 2001
Sold by
Weiler Woodrow P
Bought by
Weiler Woodrow P and Woodrow P Weiler Trust
Create a Home Valuation Report for This Property
The Home Valuation Report is an in-depth analysis detailing your home's value as well as a comparison with similar homes in the area
Home Values in the Area
Average Home Value in this Area
Purchase History
| Date | Buyer | Sale Price | Title Company |
|---|---|---|---|
| Cruz Pedro | $220,000 | Stewart Title Guaranty Co | |
| Miller Daniel J | $367,000 | First American | |
| Weiler Woodrow P | -- | -- |
Source: Public Records
Mortgage History
| Date | Status | Borrower | Loan Amount |
|---|---|---|---|
| Previous Owner | Cruz Pedro | $216,015 | |
| Previous Owner | Miller Daniel J | $293,600 |
Source: Public Records
Tax History Compared to Growth
Tax History
| Year | Tax Paid | Tax Assessment Tax Assessment Total Assessment is a certain percentage of the fair market value that is determined by local assessors to be the total taxable value of land and additions on the property. | Land | Improvement |
|---|---|---|---|---|
| 2025 | $3,678 | $283,980 | $70,995 | $212,985 |
| 2024 | $3,678 | $278,412 | $69,603 | $208,809 |
| 2023 | $3,471 | $272,953 | $68,238 | $204,715 |
| 2022 | $3,410 | $267,601 | $66,900 | $200,701 |
| 2021 | $3,353 | $262,354 | $65,588 | $196,766 |
| 2020 | $3,370 | $259,663 | $64,915 | $194,748 |
| 2019 | $3,358 | $254,571 | $63,642 | $190,929 |
| 2018 | $2,952 | $249,579 | $62,394 | $187,185 |
| 2017 | $2,887 | $244,686 | $61,171 | $183,515 |
| 2016 | $2,847 | $239,889 | $59,972 | $179,917 |
| 2015 | $2,900 | $236,285 | $59,071 | $177,214 |
| 2014 | $2,842 | $231,657 | $57,914 | $173,743 |
Source: Public Records
Map
Nearby Homes
- 10776 Sunnyside Dr
- 35246 Silver Leaf Cir
- 11050 Bryant St Unit 78
- 11050 Bryant St Unit 36
- 35110 Willow Springs Dr
- 35218 Fir Ave Unit 30
- 35218 Fir Ave Unit 183
- 35218 Fir Ave Unit 15
- 10684 Lakeview Rd
- 10622 Bryant St Unit 54
- 34900 N Serrano Square
- 35377 Shade Tree Rd
- 35420 Shade Tree Rd
- 35493 Balsa St
- 34942 S Serrano Square
- 35488 Schafer Ranch Rd
- 10675 Bryant St Unit 109
- 35425 Fir Ave
- 34696 Campus Way
- 35054 Persimmon Ave
- 10959 Laurel Grove Cir
- 10983 Laurel Grove Cir
- 10951 Laurel Grove Cir
- 10966 Sunnyside Dr
- 10958 Sunnyside Dr
- 10974 Sunnyside Dr
- 10950 Sunnyside Dr
- 10991 Laurel Grove Cir
- 10982 Sunnyside Dr
- 10942 Sunnyside Dr
- 10982 Laurel Grove Cir
- 34971 Hollyoak Way
- 10990 Sunnyside Dr
- 10966 Laurel Grove Cir
- 34983 Hollyoak Way
- 34965 Hollyoak Way
- 34991 Hollyoak Way
- 10990 Laurel Grove Cir
- 10934 Sunnyside Dr
- 34959 Hollyoak Way