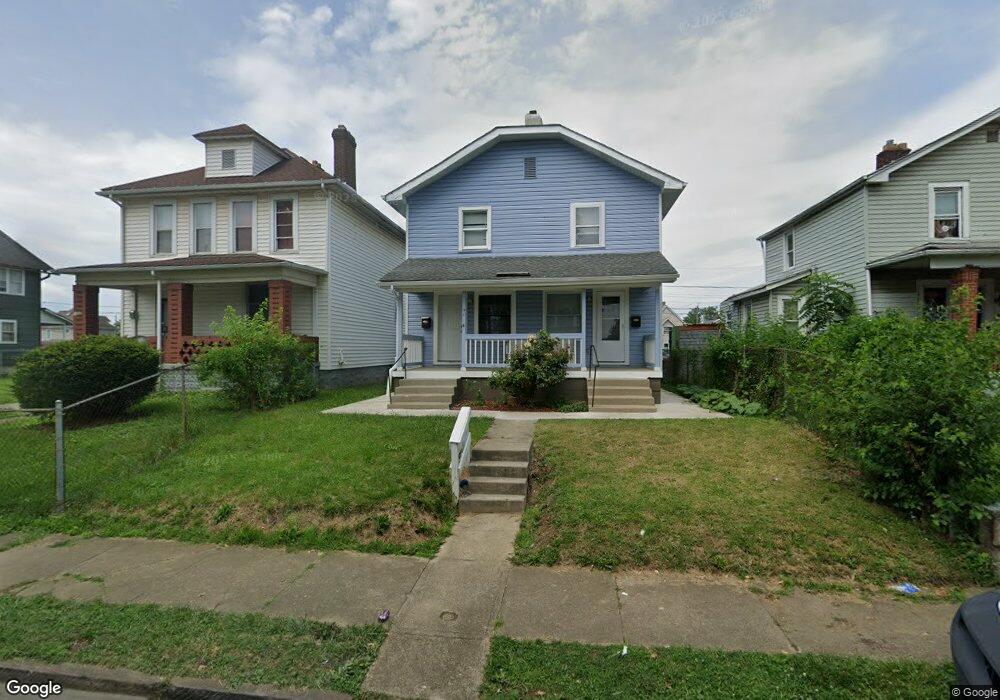
1097-1099 Peters Ave Columbus, OH 43201
Milo-Grogan NeighborhoodEstimated Value: $156,946 - $239,000
4
Beds
2
Baths
1,700
Sq Ft
$119/Sq Ft
Est. Value
About This Home
This home is located at 1097-1099 Peters Ave, Columbus, OH 43201 and is currently estimated at $202,987, approximately $119 per square foot. 1097-1099 Peters Ave is a home located in Franklin County with nearby schools including Windsor Stem Acadmey, Linden-Mckinley Stem School On Arcadia, and Columbus Performance Academy.
Ownership History
Date
Name
Owned For
Owner Type
Purchase Details
Closed on
Dec 30, 2015
Sold by
Porner Quinn J
Bought by
Garcia Maria
Current Estimated Value
Purchase Details
Closed on
Oct 22, 2007
Sold by
Hutchins Laura H and Hutchins Lara H
Bought by
Porner Quinn J
Home Financials for this Owner
Home Financials are based on the most recent Mortgage that was taken out on this home.
Original Mortgage
$49,850
Interest Rate
6.38%
Mortgage Type
Purchase Money Mortgage
Purchase Details
Closed on
Mar 19, 1998
Sold by
Wilson James T
Bought by
Hutchins Laura H
Purchase Details
Closed on
Mar 27, 1997
Sold by
Bankers Trust Co Trustee
Bought by
James T Wilson
Purchase Details
Closed on
Jan 22, 1997
Sold by
Shrf John L Priest Pr
Bought by
Bankers Trust Co Trustee
Purchase Details
Closed on
Aug 22, 1994
Sold by
State St Bank & Trust Co
Bought by
John L Priest
Create a Home Valuation Report for This Property
The Home Valuation Report is an in-depth analysis detailing your home's value as well as a comparison with similar homes in the area
Home Values in the Area
Average Home Value in this Area
Purchase History
| Date | Buyer | Sale Price | Title Company |
|---|---|---|---|
| Garcia Maria | $46,900 | Attorney | |
| Porner Quinn J | $58,000 | Attorney | |
| Hutchins Laura H | $37,500 | -- | |
| James T Wilson | $2,500 | -- | |
| Bankers Trust Co Trustee | $20,000 | -- | |
| John L Priest | $10,000 | -- |
Source: Public Records
Mortgage History
| Date | Status | Borrower | Loan Amount |
|---|---|---|---|
| Previous Owner | Porner Quinn J | $49,850 |
Source: Public Records
Tax History Compared to Growth
Tax History
| Year | Tax Paid | Tax Assessment Tax Assessment Total Assessment is a certain percentage of the fair market value that is determined by local assessors to be the total taxable value of land and additions on the property. | Land | Improvement |
|---|---|---|---|---|
| 2024 | $1,548 | $33,780 | $5,180 | $28,600 |
| 2023 | $1,529 | $33,775 | $5,180 | $28,595 |
| 2022 | $703 | $13,230 | $2,310 | $10,920 |
| 2021 | $704 | $13,230 | $2,310 | $10,920 |
| 2020 | $705 | $13,230 | $2,310 | $10,920 |
| 2019 | $714 | $11,490 | $2,000 | $9,490 |
| 2018 | $849 | $11,490 | $2,000 | $9,490 |
| 2017 | $714 | $11,490 | $2,000 | $9,490 |
| 2016 | $1,027 | $15,120 | $2,310 | $12,810 |
| 2015 | $985 | $15,120 | $2,310 | $12,810 |
| 2014 | $938 | $15,120 | $2,310 | $12,810 |
| 2013 | $564 | $16,800 | $2,555 | $14,245 |
Source: Public Records
Map
Nearby Homes
- 1082-1084 Peters Ave
- 940 Shoemaker Ave
- 940-942 Leona Ave
- 1186 Saint Clair Ave
- 927 Camden Ave
- 923 Camden Ave
- 911 Camden Ave
- 1025 Howard St
- 997-999 Gibbard Ave
- 796 Gibbard Ave
- 780-782 Gibbard Ave
- 779 Gibbard Ave
- 810-812 E 3rd Ave
- 773-775 E 3rd Ave
- 800-802 E Starr Ave
- 790-792 E Starr Ave
- 841 Saint Clair Ave
- 0 Leona Ave
- 0 E 4th Ave
- 276 E 4th Ave
- 1097 Peters Ave Unit 99
- 1103 Peters Ave
- 1093 Peters Ave
- 1111 Peters Ave
- 1083 Peters Ave Unit 85
- 1085 Peters Ave
- 1119 Peters Ave
- 1104 Lexington Ave
- 1108 Lexington Ave
- 1112 Lexington Ave
- 1096 Lexington Ave Unit 98
- 1096-1098 Lexington Ave
- 1098 Peters Ave
- 1094 Peters Ave
- 1102 Peters Ave
- 1121 Peters Ave
- 1120 Lexington Ave
- 1100 Lexington Ave
- 190 Shoemaker Ave
- 1088 Peters Ave Unit 90