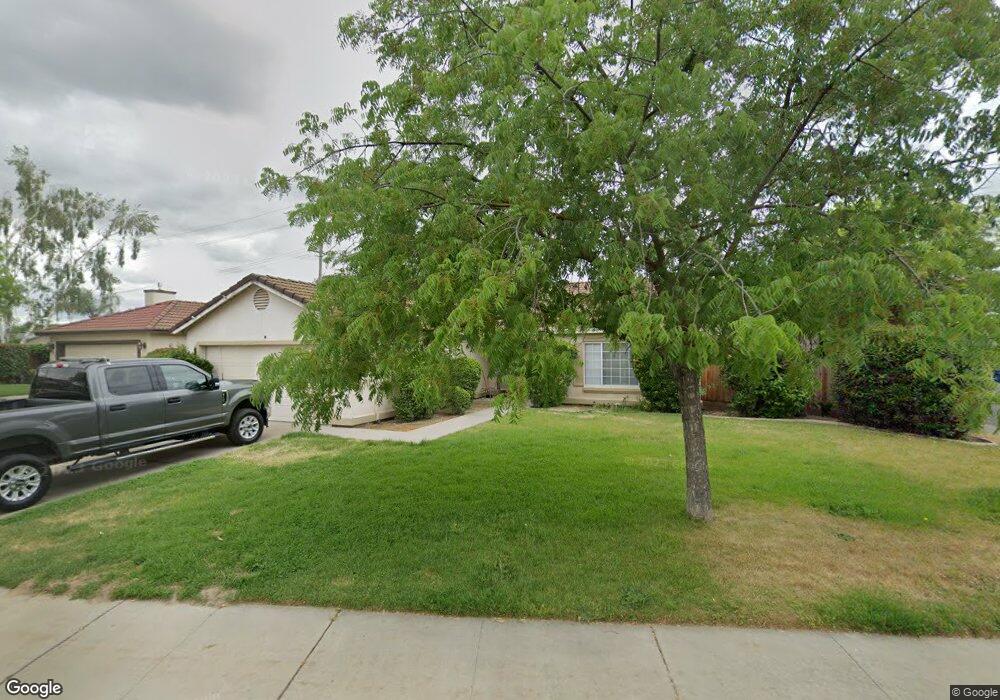
1097 Gallery Ct Turlock, CA 95380
Estimated Value: $338,000 - $496,000
3
Beds
2
Baths
1,506
Sq Ft
$288/Sq Ft
Est. Value
About This Home
This home is located at 1097 Gallery Ct, Turlock, CA 95380 and is currently estimated at $433,298, approximately $287 per square foot. 1097 Gallery Ct is a home located in Stanislaus County with nearby schools including Crowell Elementary School, Marvin A. Dutcher Middle School, and Turlock Junior High School.
Ownership History
Date
Name
Owned For
Owner Type
Purchase Details
Closed on
Mar 18, 1997
Sold by
Girdner Michael
Bought by
Yniquez Joe L and Yniquez Estella L
Current Estimated Value
Home Financials for this Owner
Home Financials are based on the most recent Mortgage that was taken out on this home.
Original Mortgage
$109,612
Outstanding Balance
$13,162
Interest Rate
7.63%
Mortgage Type
FHA
Estimated Equity
$420,136
Purchase Details
Closed on
Jun 7, 1996
Sold by
Scm Summerfaire Group
Bought by
Girdner Michael
Create a Home Valuation Report for This Property
The Home Valuation Report is an in-depth analysis detailing your home's value as well as a comparison with similar homes in the area
Purchase History
| Date | Buyer | Sale Price | Title Company |
|---|---|---|---|
| Yniquez Joe L | $110,000 | North American Title Co | |
| Girdner Michael | -- | North American Title Co | |
| Girdner Michael | $105,000 | -- |
Source: Public Records
Mortgage History
| Date | Status | Borrower | Loan Amount |
|---|---|---|---|
| Open | Yniquez Joe L | $109,612 |
Source: Public Records
Tax History
| Year | Tax Paid | Tax Assessment Tax Assessment Total Assessment is a certain percentage of the fair market value that is determined by local assessors to be the total taxable value of land and additions on the property. | Land | Improvement |
|---|---|---|---|---|
| 2025 | $1,938 | $179,134 | $48,850 | $130,284 |
| 2024 | $1,902 | $175,623 | $47,893 | $127,730 |
| 2023 | $1,899 | $172,180 | $46,954 | $125,226 |
| 2022 | $1,875 | $168,805 | $46,034 | $122,771 |
| 2021 | $1,848 | $165,496 | $45,132 | $120,364 |
| 2020 | $1,835 | $163,800 | $44,670 | $119,130 |
| 2019 | $1,805 | $160,590 | $43,795 | $116,795 |
| 2018 | $1,803 | $157,442 | $42,937 | $114,505 |
| 2017 | $1,761 | $154,356 | $42,096 | $112,260 |
| 2016 | $1,646 | $151,330 | $41,271 | $110,059 |
| 2015 | $1,632 | $149,058 | $40,652 | $108,406 |
| 2014 | $1,616 | $146,139 | $39,856 | $106,283 |
Source: Public Records
Map
Nearby Homes
- 990 Shawnan Dr
- 1400 N Tully Rd Unit 120
- 1400 N Tully Rd Unit 91
- 1400 N Tully Rd Unit 168
- 2098 Joett Dr
- 2065 Cody Ct
- 1249 Magic Sands Way
- 1253 Magic Sands Way
- 2230 Aspenwood Dr
- 1270 Magic Sands Way
- 961 Countryside Dr
- 500 N Tully Rd Unit 39
- 500 N Tully Rd
- 900 W Canal Dr Unit 100
- 900 W Canal Dr Unit 114
- 2450 Fulkerth Rd
- 2400 Fulkerth Rd
- 200 N Tully Rd
- 1186 Kay Cir
- 1114 Kay Cir
- 1077 Gallery Ct
- 1698 Joett Dr
- 1050 Shawnan Dr
- 1679 Joett Dr
- 1057 Gallery Ct
- 1096 Gallery Ct
- 1691 Joett Dr
- 1000 Shawnan Dr
- 1155 Tawny Ln
- 1076 Gallery Ct
- 1037 Gallery Ct
- 1699 Joett Dr
- 1175 Tawny Ln
- 1608 Joett Dr
- 1056 Gallery Ct
- 1701 Joett Dr
- 1051 Shawnan Dr
- 1205 Tawny Ln
- 980 Shawnan Dr
- 1001 Shawnan Dr
Your Personal Tour Guide
Ask me questions while you tour the home.