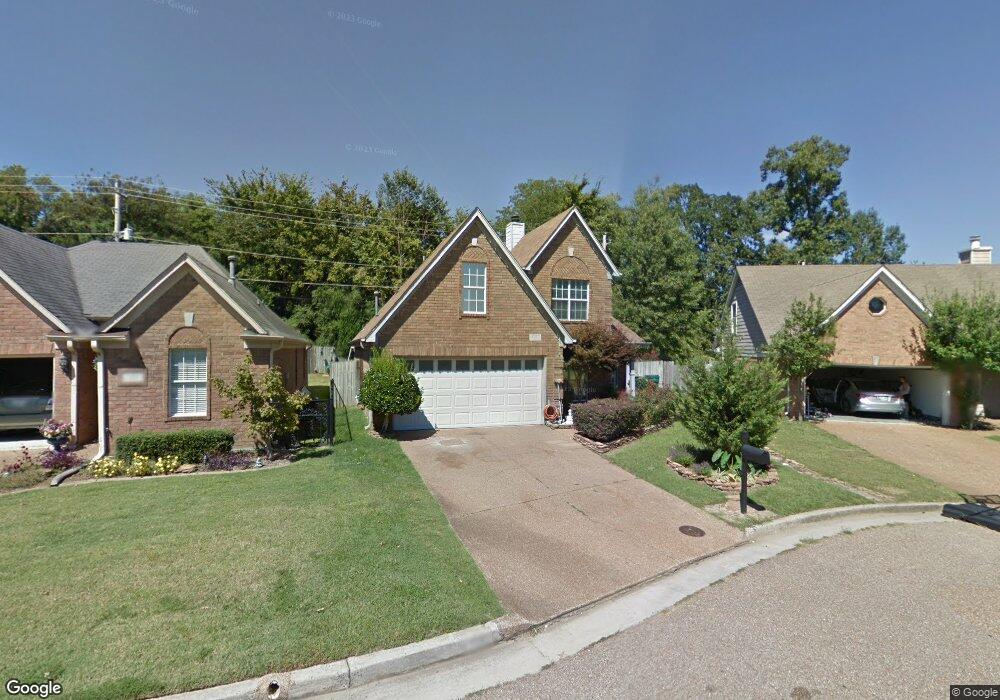
1097 Nolan Ln Cordova, TN 38018
Cordova NeighborhoodEstimated Value: $226,000 - $297,000
4
Beds
3
Baths
2,169
Sq Ft
$120/Sq Ft
Est. Value
About This Home
This home is located at 1097 Nolan Ln, Cordova, TN 38018 and is currently estimated at $259,672, approximately $119 per square foot. 1097 Nolan Ln is a home located in Shelby County with nearby schools including Dexter Elementary School, Dexter Middle School, and Cordova High School.
Ownership History
Date
Name
Owned For
Owner Type
Purchase Details
Closed on
Jul 29, 2009
Sold by
Butler Sanchioni L
Bought by
Calderon Jesus Reyes and Reyes Rosalia
Current Estimated Value
Home Financials for this Owner
Home Financials are based on the most recent Mortgage that was taken out on this home.
Original Mortgage
$135,009
Outstanding Balance
$87,979
Interest Rate
5.36%
Mortgage Type
FHA
Estimated Equity
$171,693
Purchase Details
Closed on
Nov 21, 2003
Sold by
Monroe Douglas C and Monroe Dann K
Bought by
Butler Sanchioni L
Home Financials for this Owner
Home Financials are based on the most recent Mortgage that was taken out on this home.
Original Mortgage
$133,941
Interest Rate
6.07%
Mortgage Type
FHA
Purchase Details
Closed on
Mar 14, 1997
Sold by
Sherman N W
Bought by
Lagonia Sherman Llc
Create a Home Valuation Report for This Property
The Home Valuation Report is an in-depth analysis detailing your home's value as well as a comparison with similar homes in the area
Home Values in the Area
Average Home Value in this Area
Purchase History
| Date | Buyer | Sale Price | Title Company |
|---|---|---|---|
| Calderon Jesus Reyes | $137,500 | West Tennessee Title | |
| Butler Sanchioni L | $135,000 | Realty Title & Escrow Co | |
| Lagonia Sherman Llc | $26,500 | Southern Escrow Title Compan | |
| Lagonia Sherman Llc | $26,500 | Southern Escrow Title Compan |
Source: Public Records
Mortgage History
| Date | Status | Borrower | Loan Amount |
|---|---|---|---|
| Open | Calderon Jesus Reyes | $135,009 | |
| Previous Owner | Butler Sanchioni L | $133,941 |
Source: Public Records
Tax History Compared to Growth
Tax History
| Year | Tax Paid | Tax Assessment Tax Assessment Total Assessment is a certain percentage of the fair market value that is determined by local assessors to be the total taxable value of land and additions on the property. | Land | Improvement |
|---|---|---|---|---|
| 2025 | $1,648 | $67,800 | $11,750 | $56,050 |
| 2024 | $1,648 | $48,600 | $7,500 | $41,100 |
| 2023 | $1,648 | $48,600 | $7,500 | $41,100 |
| 2022 | $1,648 | $48,600 | $7,500 | $41,100 |
| 2021 | $1,677 | $48,600 | $7,500 | $41,100 |
| 2020 | $1,422 | $35,100 | $7,500 | $27,600 |
| 2019 | $1,422 | $35,100 | $7,500 | $27,600 |
| 2018 | $1,422 | $35,100 | $7,500 | $27,600 |
| 2017 | $1,443 | $35,100 | $7,500 | $27,600 |
| 2016 | $1,288 | $29,475 | $0 | $0 |
| 2014 | $1,288 | $29,475 | $0 | $0 |
Source: Public Records
Map
Nearby Homes
- 1089 Links View Ln W
- 7468 Links View Ln S
- 7194 Charlton Way
- 7247 Winterbrook Ln
- 7303 Winterbrook Ln
- 7494 Links View Ln S
- 887 Dalemore Ln
- 7420 Dal Whinnie Trail
- 7486 Dal Whinnie Trail
- 7565 Wintergreen Ln
- 6990 Parkbrook Ln
- 1277 Winter Springs Ln
- 1321 Winter Springs Ln
- 7520 Crystal Lake Dr
- 1382 Exbury Dr
- 6884 Wrigley Dr
- 6890 Century Oaks Dr
- 6880 Wrigley Dr
- 7412 Lost Trail Dr
- 7426 Lost Trail Dr