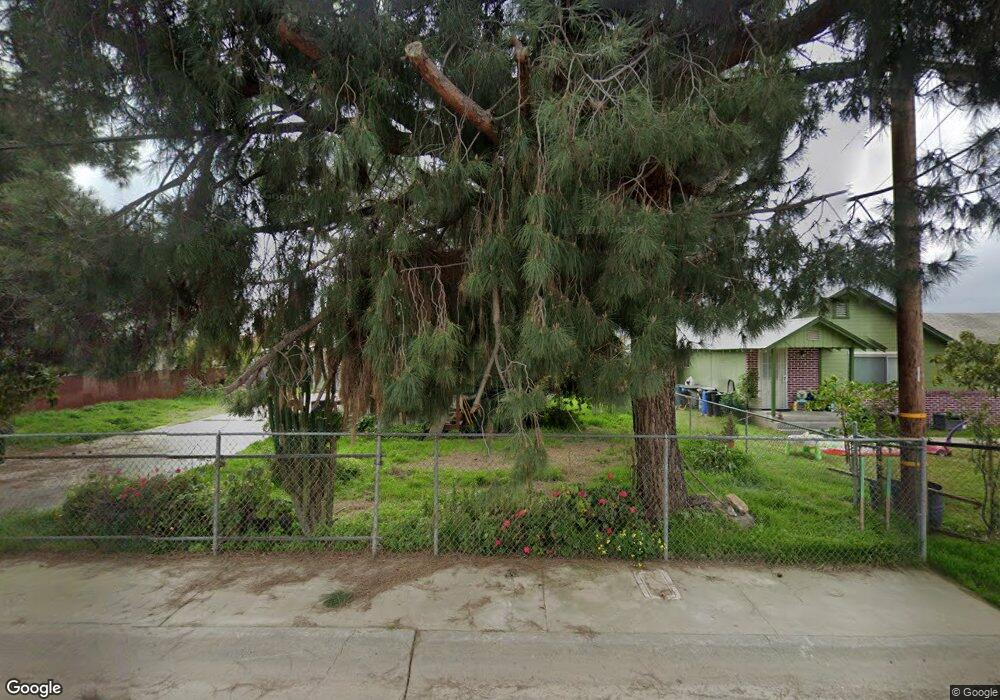
1097 W Roby Ave Porterville, CA 93257
Southwest Porterville NeighborhoodEstimated Value: $172,457 - $250,000
2
Beds
1
Bath
733
Sq Ft
$290/Sq Ft
Est. Value
About This Home
This home is located at 1097 W Roby Ave, Porterville, CA 93257 and is currently estimated at $212,364, approximately $289 per square foot. 1097 W Roby Ave is a home located in Tulare County with nearby schools including West Putnam Elementary School, Sequoia Middle School, and Porterville High School.
Ownership History
Date
Name
Owned For
Owner Type
Purchase Details
Closed on
Nov 1, 2018
Sold by
Alcantar Maria Elena
Bought by
Alcantar Maria Elena and Alcantar Dereida
Current Estimated Value
Purchase Details
Closed on
Nov 6, 2000
Sold by
Mahaffey Vicki J
Bought by
Alcantar Maria Elena
Home Financials for this Owner
Home Financials are based on the most recent Mortgage that was taken out on this home.
Original Mortgage
$59,073
Interest Rate
7.41%
Mortgage Type
FHA
Purchase Details
Closed on
May 1, 1998
Sold by
Mahaffey Vicki J
Bought by
Mccorkill Thomas H
Purchase Details
Closed on
May 1, 1997
Sold by
Mccorkill Thomas H
Bought by
Mahaffey Vicki J
Home Financials for this Owner
Home Financials are based on the most recent Mortgage that was taken out on this home.
Original Mortgage
$15,000
Interest Rate
7.98%
Mortgage Type
Purchase Money Mortgage
Create a Home Valuation Report for This Property
The Home Valuation Report is an in-depth analysis detailing your home's value as well as a comparison with similar homes in the area
Home Values in the Area
Average Home Value in this Area
Purchase History
| Date | Buyer | Sale Price | Title Company |
|---|---|---|---|
| Alcantar Maria Elena | -- | None Available | |
| Alcantar Maria Elena | $60,000 | First American Title Co | |
| Mccorkill Thomas H | -- | -- | |
| Mahaffey Vicki J | -- | -- |
Source: Public Records
Mortgage History
| Date | Status | Borrower | Loan Amount |
|---|---|---|---|
| Previous Owner | Alcantar Maria Elena | $59,073 | |
| Previous Owner | Mahaffey Vicki J | $15,000 |
Source: Public Records
Tax History Compared to Growth
Tax History
| Year | Tax Paid | Tax Assessment Tax Assessment Total Assessment is a certain percentage of the fair market value that is determined by local assessors to be the total taxable value of land and additions on the property. | Land | Improvement |
|---|---|---|---|---|
| 2025 | $884 | $90,410 | $30,134 | $60,276 |
| 2024 | $884 | $88,639 | $29,544 | $59,095 |
| 2023 | $882 | $86,902 | $28,965 | $57,937 |
| 2022 | $853 | $85,199 | $28,398 | $56,801 |
| 2021 | $842 | $83,528 | $27,841 | $55,687 |
| 2020 | $832 | $82,672 | $27,556 | $55,116 |
| 2019 | $816 | $81,051 | $27,016 | $54,035 |
| 2018 | $800 | $79,461 | $26,486 | $52,975 |
| 2017 | $725 | $73,000 | $18,000 | $55,000 |
| 2016 | $623 | $65,000 | $16,000 | $49,000 |
| 2015 | $385 | $56,000 | $14,000 | $42,000 |
| 2014 | $385 | $43,000 | $11,000 | $32,000 |
Source: Public Records
Map
Nearby Homes
- 1066 W Forest Ave
- 1127 W Orange Ave
- 53 N Prospect St
- 1140 Tomah Ave
- 63 N Wisconsin St
- 66 S Beverly St
- 1262 Tomah Ave
- 553 S Cloverleaf St
- 1137 W Putnam Ave
- 1147 W Putnam Ave
- 643 S Cloverleaf St
- 36 S Chess Terrace St
- 1502 W River Ave
- 360 N Capitola Ct Unit 4
- 0 SE Indianna & Springville Dr Unit 221030
- 1343 W Morton Ave Unit Sp 84
- 579 S Villa St
- 0 W Morton Unit 234694
- 1183 S Creekside St
- 1152 S Creekside St
- 1107 W Roby Ave
- 1087 W Roby Ave
- 1119 W Roby Ave
- 1106 W Forest Ave
- 1096 W Forest Ave
- 1075 W Roby Ave
- 1125 W Roby Ave
- 1126 W Forest Ave
- 1076 W Forest Ave
- 1110 W Roby Ave
- 1139 W Roby Ave
- 1096 W Roby Ave
- 1090 W Roby Ave
- 1136 W Forest Ave
- 1103 W Forest Ave
- 1124 W Roby Ave
- 1086 W Forest Ave
- 1093 W Forest Ave
- 1113 W Forest Ave
- 1146 W Forest Ave