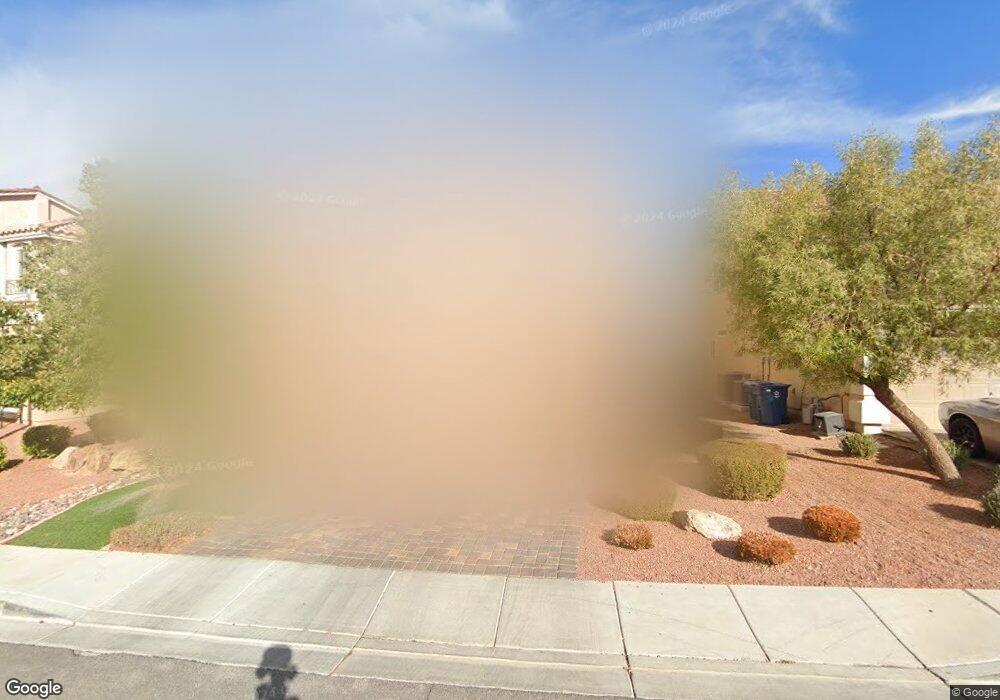
10970 Shallow Water Ct Henderson, NV 89052
Silverado Ranch NeighborhoodEstimated Value: $544,000 - $654,000
4
Beds
3
Baths
2,985
Sq Ft
$199/Sq Ft
Est. Value
About This Home
This home is located at 10970 Shallow Water Ct, Henderson, NV 89052 and is currently estimated at $595,485, approximately $199 per square foot. 10970 Shallow Water Ct is a home with nearby schools including Shirley A Barber Elementary, Charles Silvestri Junior High School, and Liberty High School.
Ownership History
Date
Name
Owned For
Owner Type
Purchase Details
Closed on
Mar 31, 2020
Sold by
Khuu Daniel and Khuu Tuan
Bought by
Khuu Tuan A and Khuu Maryrose M
Current Estimated Value
Purchase Details
Closed on
Apr 10, 2013
Sold by
Magsaysay Maryrose
Bought by
Khuu Tuan
Home Financials for this Owner
Home Financials are based on the most recent Mortgage that was taken out on this home.
Original Mortgage
$301,068
Outstanding Balance
$210,382
Interest Rate
3.25%
Mortgage Type
FHA
Estimated Equity
$385,103
Purchase Details
Closed on
Feb 6, 2013
Sold by
Silverado Summit Llc
Bought by
Khuu Daniel and Khuu Tuan
Purchase Details
Closed on
Apr 6, 2012
Sold by
Silverado Springs 2 Llc
Bought by
Silverado Summit Llc
Purchase Details
Closed on
Aug 4, 2010
Sold by
Silverado Springs 1 Inc
Bought by
Silverado Springs 2 Llc
Create a Home Valuation Report for This Property
The Home Valuation Report is an in-depth analysis detailing your home's value as well as a comparison with similar homes in the area
Home Values in the Area
Average Home Value in this Area
Purchase History
| Date | Buyer | Sale Price | Title Company |
|---|---|---|---|
| Khuu Tuan A | -- | None Available | |
| Khuu Tuan | -- | First American Title Centra | |
| Khuu Daniel | $306,622 | First American Title Centra | |
| Silverado Summit Llc | -- | Accommodation | |
| Silverado Springs 2 Llc | -- | Accommodation |
Source: Public Records
Mortgage History
| Date | Status | Borrower | Loan Amount |
|---|---|---|---|
| Open | Khuu Tuan | $301,068 |
Source: Public Records
Tax History Compared to Growth
Tax History
| Year | Tax Paid | Tax Assessment Tax Assessment Total Assessment is a certain percentage of the fair market value that is determined by local assessors to be the total taxable value of land and additions on the property. | Land | Improvement |
|---|---|---|---|---|
| 2025 | $3,115 | $185,794 | $49,000 | $136,794 |
| 2024 | $3,025 | $185,794 | $49,000 | $136,794 |
| 2023 | $3,025 | $169,912 | $41,650 | $128,262 |
| 2022 | $2,937 | $153,928 | $37,450 | $116,478 |
| 2021 | $2,851 | $142,823 | $32,550 | $110,273 |
| 2020 | $2,765 | $135,940 | $32,550 | $103,390 |
| 2019 | $2,685 | $122,490 | $29,400 | $93,090 |
| 2018 | $2,562 | $119,405 | $22,750 | $96,655 |
| 2017 | $3,368 | $114,837 | $21,350 | $93,487 |
| 2016 | $2,398 | $103,852 | $15,750 | $88,102 |
| 2015 | $2,393 | $97,089 | $18,900 | $78,189 |
| 2014 | $2,323 | $10,500 | $10,500 | $0 |
Source: Public Records
Map
Nearby Homes
- 10949 Pinion Woods Ct
- 10936 Shallow Water Ct
- 1010 Saffex Rose Ave
- 968 Lucky Bamboo Dr
- 10840 Holmfield St
- 10925 Sadlers Wells St
- 895 Beartooth Falls Ct
- 867 Blushing Rose Place
- 886 Blue Rosalie Place
- 10714 Holmfield St
- 11066 Arcadia Sunrise Dr
- 11038 African Sunset St
- 1041 Grand Cerritos Ave
- 1135 Volcanic Garden Ct Unit 101
- 11140 African Sunset St
- 10656 Timber Stand St
- 10968 Geyser Peak St
- 10568 Salmon Leap St
- 3629 Via Messina
- 3641 Via Terracina
- 10960 Shallow Water Ct
- 10978 Shallow Water Ct
- 10946 Shallow Water Ct
- 10986 Shallow Water Ct
- 10941 Pinion Woods Ct
- 10957 Pinion Woods Ct
- 10969 Shallow Water Ct
- 10961 Shallow Water Ct
- 10977 Shallow Water Ct
- 10933 Pinion Woods Ct
- 10965 Pinion Woods Ct
- 10953 Shallow Water Ct
- 10985 Shallow Water Ct
- 10945 Shallow Water Ct
- 10925 Pinion Woods Ct
- 10926 Shallow Water Ct
- 10937 Shallow Water Ct
- 1101 Saffex Rose Ave
- 10962 Pinion Woods Ct
- 10929 Shallow Water Ct