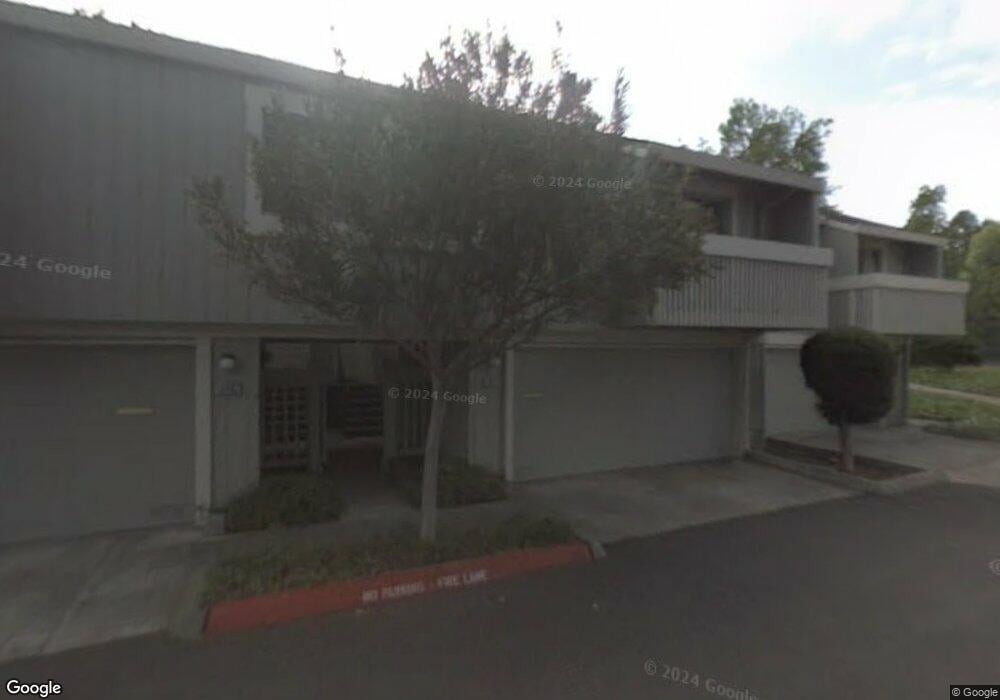
10974 Northseal Square Unit 2 Cupertino, CA 95014
North Cupertino NeighborhoodEstimated Value: $1,182,000 - $1,265,000
2
Beds
2
Baths
1,060
Sq Ft
$1,152/Sq Ft
Est. Value
About This Home
This home is located at 10974 Northseal Square Unit 2, Cupertino, CA 95014 and is currently estimated at $1,221,044, approximately $1,151 per square foot. 10974 Northseal Square Unit 2 is a home located in Santa Clara County with nearby schools including L. P. Collins Elementary School, Cupertino Middle School, and Fremont High School.
Ownership History
Date
Name
Owned For
Owner Type
Purchase Details
Closed on
May 21, 2020
Sold by
Ranka Anil S and Jain Sharmila K
Bought by
Ranka Anil Sampatraj and Jain Sharmila Kantilalji
Current Estimated Value
Purchase Details
Closed on
Nov 13, 2006
Sold by
Bisbee Matthew
Bought by
Ranka Anil S and Jain Sharmila K
Home Financials for this Owner
Home Financials are based on the most recent Mortgage that was taken out on this home.
Original Mortgage
$467,156
Outstanding Balance
$271,003
Interest Rate
5.87%
Mortgage Type
Purchase Money Mortgage
Estimated Equity
$950,041
Purchase Details
Closed on
Sep 15, 2004
Sold by
Shostak Vyacheslav M
Bought by
Bisbee Matthew
Home Financials for this Owner
Home Financials are based on the most recent Mortgage that was taken out on this home.
Original Mortgage
$399,200
Interest Rate
4.62%
Mortgage Type
Purchase Money Mortgage
Purchase Details
Closed on
Aug 21, 2003
Sold by
Dauber Steven M
Bought by
Shostak Vyacheslav
Create a Home Valuation Report for This Property
The Home Valuation Report is an in-depth analysis detailing your home's value as well as a comparison with similar homes in the area
Home Values in the Area
Average Home Value in this Area
Purchase History
| Date | Buyer | Sale Price | Title Company |
|---|---|---|---|
| Ranka Anil Sampatraj | -- | None Available | |
| Ranka Anil S | -- | Chicago Title Company | |
| Bisbee Matthew | $498,500 | Financial Title Company | |
| Shostak Vyacheslav | $400,000 | Financial Title Company |
Source: Public Records
Mortgage History
| Date | Status | Borrower | Loan Amount |
|---|---|---|---|
| Open | Ranka Anil S | $467,156 | |
| Previous Owner | Bisbee Matthew | $399,200 | |
| Closed | Bisbee Matthew | $49,900 |
Source: Public Records
Tax History Compared to Growth
Tax History
| Year | Tax Paid | Tax Assessment Tax Assessment Total Assessment is a certain percentage of the fair market value that is determined by local assessors to be the total taxable value of land and additions on the property. | Land | Improvement |
|---|---|---|---|---|
| 2025 | $9,877 | $782,422 | $391,211 | $391,211 |
| 2024 | $9,877 | $767,082 | $383,541 | $383,541 |
| 2023 | $9,772 | $752,042 | $376,021 | $376,021 |
| 2022 | $9,805 | $737,298 | $368,649 | $368,649 |
| 2021 | $9,690 | $722,842 | $361,421 | $361,421 |
| 2020 | $9,562 | $715,432 | $357,716 | $357,716 |
| 2019 | $9,314 | $701,404 | $350,702 | $350,702 |
| 2018 | $9,020 | $687,652 | $343,826 | $343,826 |
| 2017 | $8,943 | $674,170 | $337,085 | $337,085 |
| 2016 | $8,648 | $660,952 | $330,476 | $330,476 |
| 2015 | $8,571 | $651,024 | $325,512 | $325,512 |
| 2014 | $8,346 | $638,272 | $319,136 | $319,136 |
Source: Public Records
Map
Nearby Homes
- 20245 Northglen Square
- 20192 Northcove Square
- 1668 Goldfinch Way
- 20676 Celeste Cir Unit 71
- 20666 Celeste Cir Unit 59
- 1744 Lark Ln
- 1579 Heron Ave
- 1479 Blackhawk Ct
- 10631 Mine Ct
- 125 Connemara Way Unit 3
- 125 Connemara Way Unit 98
- 1467 Dove Ln
- 10240 Randy Ln
- 861 Flin Way
- 20730 Dunbar Dr
- 1567 Magpie Ln
- 1626 S Wolfe Rd
- 532 Cashmere Ct
- 512 S Cascade Terrace
- 19999 Stevens Creek Blvd Unit 209
- 10974 Northseal Square
- 10982 Northseal Square
- 10972 Northseal Square
- 10984 Northseal Square
- 10964 Northseal Square
- 10992 Northseal Square
- 10962 Northseal Square
- 10941 Northsky Square
- 10943 Northsky Square
- 10951 Northsky Square
- 10954 Northseal Square
- 10994 Northseal Square
- 10953 Northsky Square
- 10952 Northseal Square
- 11002 Northseal Square
- 10961 Northsky Square
- 10937 Northseal Square
- 10935 Northseal Square
- 10945 Northseal Square
- 10944 Northseal Square