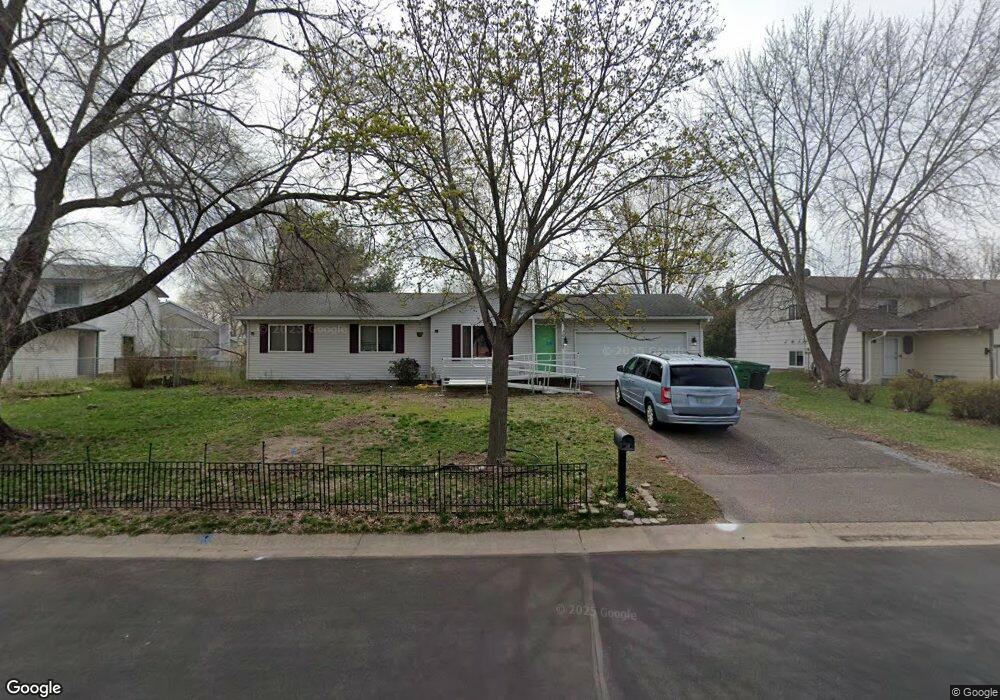
10977 Osage St NW Coon Rapids, MN 55433
Estimated Value: $344,000 - $360,182
4
Beds
2
Baths
1,070
Sq Ft
$330/Sq Ft
Est. Value
About This Home
This home is located at 10977 Osage St NW, Coon Rapids, MN 55433 and is currently estimated at $353,546, approximately $330 per square foot. 10977 Osage St NW is a home located in Anoka County with nearby schools including Lucile Bruner Elementary School, Hamilton Elementary School, and Laughlin Junior/Senior High School.
Ownership History
Date
Name
Owned For
Owner Type
Purchase Details
Closed on
Jul 19, 2019
Sold by
Lingbeek Eric R and Lingbeek Jessica L
Bought by
Vilayvanh Christina M and Vilayvanh Phouthieng
Current Estimated Value
Home Financials for this Owner
Home Financials are based on the most recent Mortgage that was taken out on this home.
Original Mortgage
$240,562
Outstanding Balance
$212,578
Interest Rate
4.25%
Mortgage Type
FHA
Estimated Equity
$140,968
Purchase Details
Closed on
Aug 11, 2008
Sold by
Deutsche Bank National Trust
Bought by
Lingbeek Jessica L and Lingbeek Eric R
Home Financials for this Owner
Home Financials are based on the most recent Mortgage that was taken out on this home.
Original Mortgage
$146,840
Interest Rate
6.87%
Mortgage Type
FHA
Create a Home Valuation Report for This Property
The Home Valuation Report is an in-depth analysis detailing your home's value as well as a comparison with similar homes in the area
Home Values in the Area
Average Home Value in this Area
Purchase History
| Date | Buyer | Sale Price | Title Company |
|---|---|---|---|
| Vilayvanh Christina M | $245,000 | Titlesmart Inc | |
| Lingbeek Jessica L | $148,000 | -- |
Source: Public Records
Mortgage History
| Date | Status | Borrower | Loan Amount |
|---|---|---|---|
| Open | Vilayvanh Christina M | $240,562 | |
| Previous Owner | Lingbeek Jessica L | $146,840 |
Source: Public Records
Tax History Compared to Growth
Tax History
| Year | Tax Paid | Tax Assessment Tax Assessment Total Assessment is a certain percentage of the fair market value that is determined by local assessors to be the total taxable value of land and additions on the property. | Land | Improvement |
|---|---|---|---|---|
| 2025 | $3,364 | $325,800 | $92,400 | $233,400 |
| 2024 | $3,364 | $323,800 | $95,700 | $228,100 |
| 2023 | $3,051 | $311,800 | $83,600 | $228,200 |
| 2022 | $2,992 | $313,900 | $73,700 | $240,200 |
| 2021 | $2,748 | $265,100 | $73,700 | $191,400 |
| 2020 | $2,673 | $249,000 | $68,200 | $180,800 |
| 2019 | $2,694 | $233,500 | $66,000 | $167,500 |
| 2018 | $2,590 | $213,800 | $0 | $0 |
| 2017 | $2,293 | $200,000 | $0 | $0 |
| 2016 | $2,109 | $171,400 | $0 | $0 |
| 2015 | -- | $171,400 | $49,500 | $121,900 |
| 2014 | -- | $140,100 | $36,500 | $103,600 |
Source: Public Records
Map
Nearby Homes
- 11036 Hanson Blvd NW Unit 20
- 11000 Swallow St NW
- 2201 108th Ave NW
- 2400 108th Ave NW
- 11409 Quinn St NW
- 11424 Hanson Blvd NW
- 10648 Wren St NW
- 11444 Hanson Blvd NW
- 10658 Hummingbird St NW
- 11350 Jay St NW
- 10634 Hummingbird St NW
- 11361 Jay St NW
- 1900 Coon Rapids Blvd NW Unit 1
- 2001 103rd Ln NW
- 2721 109th Ave NW
- 10616 Arrowhead St NW
- 2728 109th Ln NW
- 11267 Robinson Dr NW
- 10239 Raven St NW
- 10309 Yukon St NW
- 10965 Osage St NW
- 10985 Osage St NW
- 10961 Osage St NW
- 2086 110th Ave NW
- 11001 Osage St NW
- 10953 Osage St NW
- 2090 110th Ave NW
- 11005 Osage St NW
- 2103 109th Ln NW
- 10988 Hanson Blvd NW
- 11032 Hanson Blvd NW Unit 12
- 2107 109th Ln NW
- 10947 Osage St NW
- 2081 110th Ave NW
- xxxx Larch St NW
- 12511 Larch St NW
- 11028 Hanson Blvd NW Unit 9
- 10992 Hanson Blvd NW
- 11009 Osage St NW
- 2106 110th Ave NW