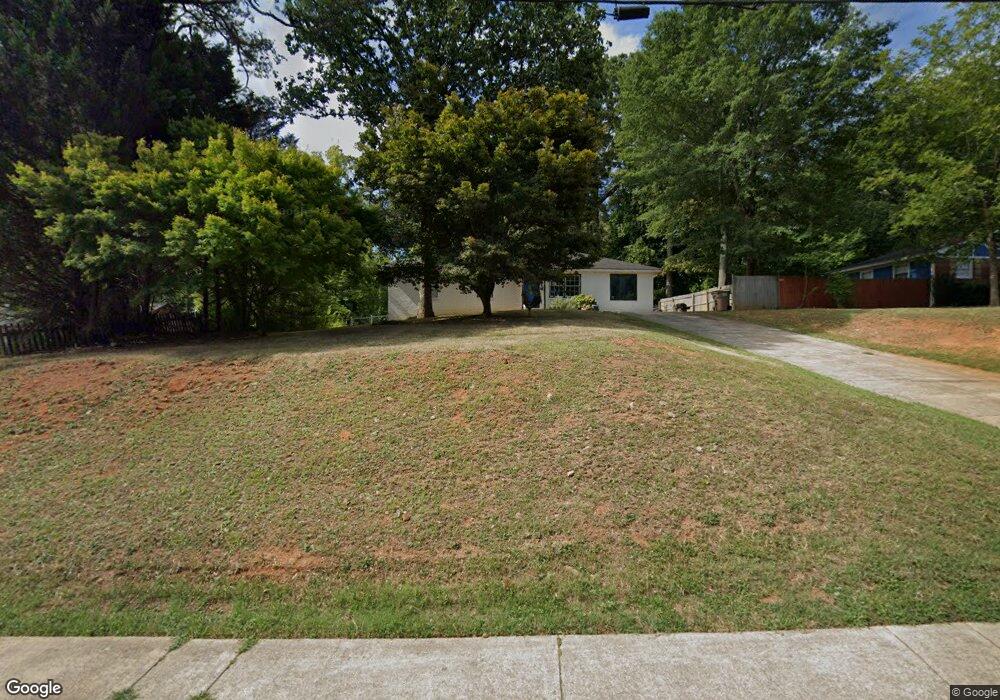
1098 Jamerson Rd Marietta, GA 30066
Sandy Plains NeighborhoodEstimated Value: $301,000 - $350,000
2
Beds
2
Baths
1,148
Sq Ft
$277/Sq Ft
Est. Value
About This Home
This home is located at 1098 Jamerson Rd, Marietta, GA 30066 and is currently estimated at $318,153, approximately $277 per square foot. 1098 Jamerson Rd is a home located in Cobb County with nearby schools including Keheley Elementary School, McCleskey Middle School, and Kell High School.
Ownership History
Date
Name
Owned For
Owner Type
Purchase Details
Closed on
Dec 2, 2002
Sold by
Anthony Charles and Anthony Rebecca L
Bought by
Cochran Bradley L
Current Estimated Value
Home Financials for this Owner
Home Financials are based on the most recent Mortgage that was taken out on this home.
Original Mortgage
$127,511
Outstanding Balance
$54,508
Interest Rate
6.3%
Mortgage Type
FHA
Estimated Equity
$263,645
Purchase Details
Closed on
Mar 31, 2000
Sold by
Mulkey Jeffrey C
Bought by
Anthony Charles
Home Financials for this Owner
Home Financials are based on the most recent Mortgage that was taken out on this home.
Original Mortgage
$98,700
Interest Rate
8.34%
Mortgage Type
FHA
Purchase Details
Closed on
Nov 17, 1993
Sold by
Boddiford Dyches V
Bought by
Mulkey Jeffrey C
Home Financials for this Owner
Home Financials are based on the most recent Mortgage that was taken out on this home.
Original Mortgage
$53,612
Interest Rate
11%
Mortgage Type
FHA
Create a Home Valuation Report for This Property
The Home Valuation Report is an in-depth analysis detailing your home's value as well as a comparison with similar homes in the area
Home Values in the Area
Average Home Value in this Area
Purchase History
| Date | Buyer | Sale Price | Title Company |
|---|---|---|---|
| Cochran Bradley L | $129,600 | -- | |
| Anthony Charles | $90,800 | -- | |
| Mulkey Jeffrey C | $13,200 | -- |
Source: Public Records
Mortgage History
| Date | Status | Borrower | Loan Amount |
|---|---|---|---|
| Open | Cochran Bradley L | $127,511 | |
| Previous Owner | Anthony Charles | $98,700 | |
| Previous Owner | Mulkey Jeffrey C | $53,612 | |
| Closed | Mulkey Jeffrey C | $73,609 |
Source: Public Records
Tax History Compared to Growth
Tax History
| Year | Tax Paid | Tax Assessment Tax Assessment Total Assessment is a certain percentage of the fair market value that is determined by local assessors to be the total taxable value of land and additions on the property. | Land | Improvement |
|---|---|---|---|---|
| 2025 | $2,952 | $97,988 | $20,800 | $77,188 |
| 2024 | $2,954 | $97,988 | $20,800 | $77,188 |
| 2023 | $2,132 | $70,700 | $16,000 | $54,700 |
| 2022 | $2,146 | $70,700 | $16,000 | $54,700 |
| 2021 | $2,146 | $70,700 | $16,000 | $54,700 |
| 2020 | $2,146 | $70,700 | $16,000 | $54,700 |
| 2019 | $1,416 | $46,640 | $12,800 | $33,840 |
| 2018 | $1,416 | $46,640 | $12,800 | $33,840 |
| 2017 | $1,341 | $46,640 | $12,800 | $33,840 |
| 2016 | $1,341 | $46,640 | $12,800 | $33,840 |
| 2015 | $1,010 | $34,284 | $13,300 | $20,984 |
| 2014 | $1,019 | $34,284 | $0 | $0 |
Source: Public Records
Map
Nearby Homes
- 4855 Rockford Ridge Dr
- 933 Old Noonday Sch House Rd
- 2899 Treeside Terrace
- 694 Smokey Quartz Way
- 703 Smokey Quartz Way
- 706 Smokey Quartz Way
- 702 Smokey Quartz Way
- 710 Smokey Quartz Way
- 707 Smokey Quartz Way
- 4816 Olde Mill Dr
- 1244 Hickory Wood Dr NE
- 4680 Jamerson Forest Pkwy
- 4669 Blue Topaz Trail
- The Cary A Plan at The Village at Shallowford - Classic Series
- The Marion A Plan at The Village at Shallowford - Classic Series
- 572 Dover St
- 421 Creek Valley Dr
- 5073 Farm Valley Dr NE
- 1528 Forest Trace
- 4413 Inlet Rd
- 1108 Jamerson Rd
- 1088 Jamerson Rd
- 1076 Jamerson Rd
- 1140 Jamerson Rd
- 1160 Jamerson Rd
- 4825 Chapelle Ct
- 1064 Jamerson Rd
- 1064 Jamerson Rd Unit 4
- 4827 Chapelle Ct
- 1064 Jamerson Rd
- 4823 Chapelle Ct
- 4821 Chapelle Ct
- 0 Jamerson Rd NE Unit 7456596
- 4829 Chapelle Ct
- 1052 Jamerson Rd
- 1008 Jamerson Rd
- 4826 Chapelle Ct
- 4800 Nevilly Way
- 4803 Nevilly Way
- 1151 Lake Dr