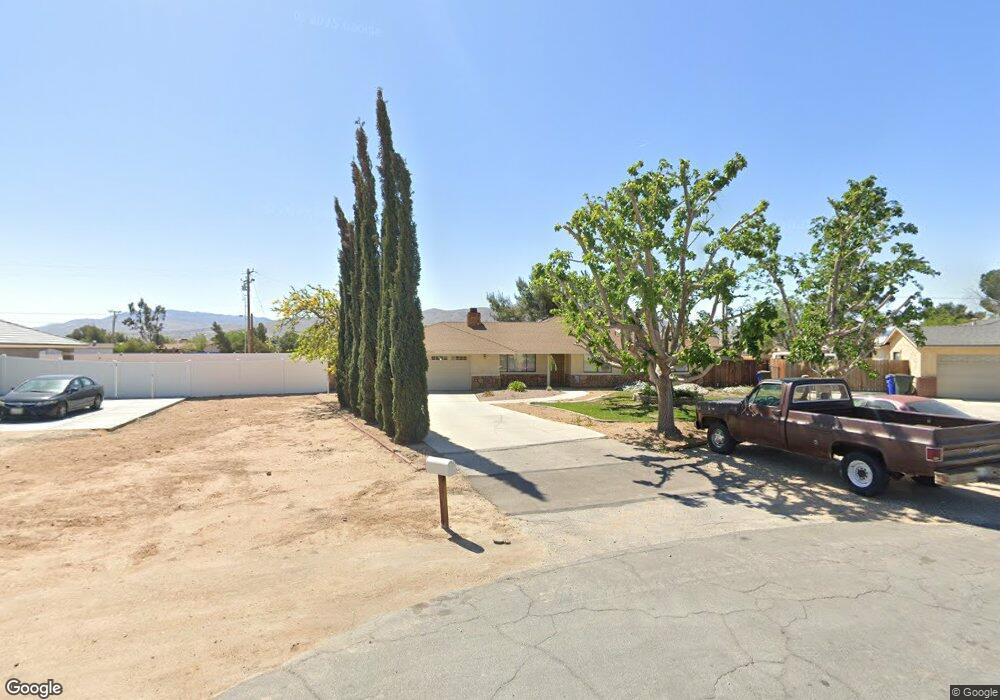
10980 Neola Ct Apple Valley, CA 92308
High Desert NeighborhoodEstimated Value: $390,000 - $409,000
3
Beds
2
Baths
1,418
Sq Ft
$280/Sq Ft
Est. Value
About This Home
This home is located at 10980 Neola Ct, Apple Valley, CA 92308 and is currently estimated at $396,939, approximately $279 per square foot. 10980 Neola Ct is a home located in San Bernardino County with nearby schools including Sandia Elementary School and Apple Valley High School.
Ownership History
Date
Name
Owned For
Owner Type
Purchase Details
Closed on
Nov 23, 1999
Sold by
Bacon Bruce D and Bacon Lynn M
Bought by
Wilson Maggie E
Current Estimated Value
Home Financials for this Owner
Home Financials are based on the most recent Mortgage that was taken out on this home.
Original Mortgage
$78,878
Outstanding Balance
$23,952
Interest Rate
7.68%
Mortgage Type
FHA
Estimated Equity
$372,987
Purchase Details
Closed on
Dec 14, 1998
Sold by
Hud
Bought by
Bacon Bruce D and Bacon Lynn M
Home Financials for this Owner
Home Financials are based on the most recent Mortgage that was taken out on this home.
Original Mortgage
$41,407
Interest Rate
6.63%
Purchase Details
Closed on
Aug 24, 1998
Sold by
Chemical Mtg Company
Bought by
Hud
Create a Home Valuation Report for This Property
The Home Valuation Report is an in-depth analysis detailing your home's value as well as a comparison with similar homes in the area
Home Values in the Area
Average Home Value in this Area
Purchase History
| Date | Buyer | Sale Price | Title Company |
|---|---|---|---|
| Wilson Maggie E | $79,000 | Lawyers Title Company | |
| Bacon Bruce D | $55,500 | American Title | |
| Hud | -- | Fidelity National Title Ins | |
| Chase Mtg Company | $78,365 | Fidelity National Title Ins |
Source: Public Records
Mortgage History
| Date | Status | Borrower | Loan Amount |
|---|---|---|---|
| Open | Wilson Maggie E | $78,878 | |
| Previous Owner | Bacon Bruce D | $41,407 |
Source: Public Records
Tax History Compared to Growth
Tax History
| Year | Tax Paid | Tax Assessment Tax Assessment Total Assessment is a certain percentage of the fair market value that is determined by local assessors to be the total taxable value of land and additions on the property. | Land | Improvement |
|---|---|---|---|---|
| 2025 | $1,467 | $121,424 | $20,641 | $100,783 |
| 2024 | $1,467 | $119,043 | $20,236 | $98,807 |
| 2023 | $1,453 | $116,709 | $19,839 | $96,870 |
| 2022 | $1,431 | $114,421 | $19,450 | $94,971 |
| 2021 | $1,399 | $112,178 | $19,069 | $93,109 |
| 2020 | $1,381 | $111,027 | $18,873 | $92,154 |
| 2019 | $1,356 | $108,850 | $18,503 | $90,347 |
| 2018 | $1,323 | $106,715 | $18,140 | $88,575 |
| 2017 | $1,304 | $104,622 | $17,784 | $86,838 |
| 2016 | $1,224 | $102,570 | $17,435 | $85,135 |
| 2015 | $1,206 | $101,029 | $17,173 | $83,856 |
| 2014 | $1,190 | $99,050 | $16,837 | $82,213 |
Source: Public Records
Map
Nearby Homes
- 20911 Wren St
- 20489 Wren St
- 65 Kiowa Place
- 10990 Caribou Ave
- 21055 Valencia St
- 3 Del Oro Rd
- 20855 Otowi Rd
- 21044 Wisteria St
- 21295 Wisteria St
- 10350 Merino Ave
- 22109 Tussing Ranch Rd
- 21259 Rosewood St
- 11228 Mockingbird Ave
- 11542 Chimayo Rd
- 10420 Kiowa Rd
- 10516 Mohawk Rd
- 10533 Mohawk Rd
- 11414 Serra Rd Unit 76
- 11414 Serra Rd Unit 73
- 11414 Serra Rd Unit 36