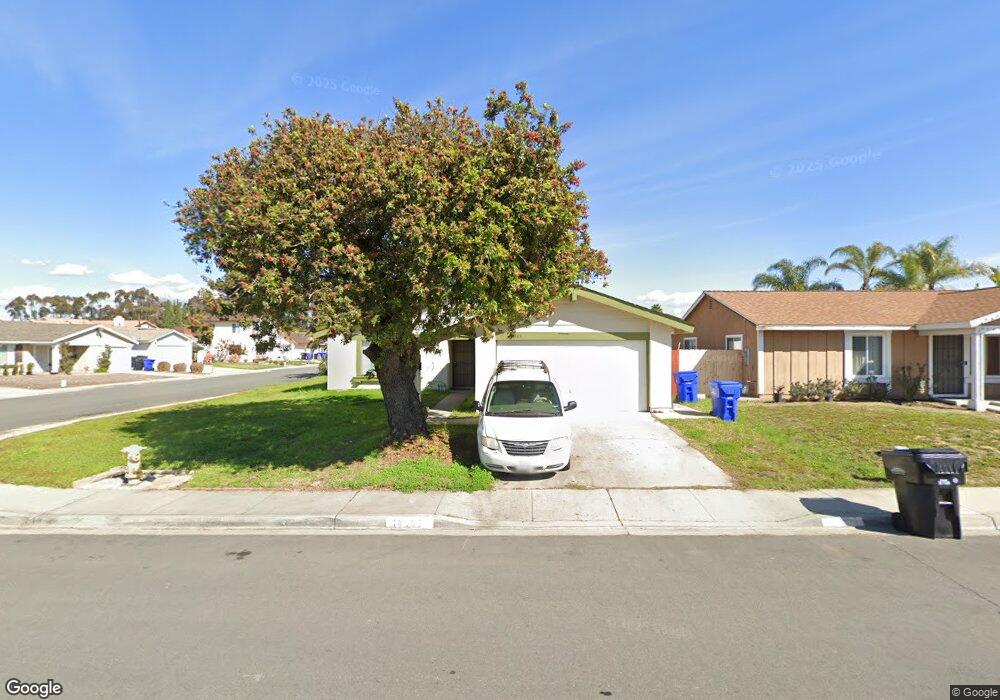
10983 Parkdale Ave San Diego, CA 92126
Mira Mesa NeighborhoodEstimated Value: $1,058,947 - $1,081,000
4
Beds
2
Baths
1,606
Sq Ft
$665/Sq Ft
Est. Value
About This Home
This home is located at 10983 Parkdale Ave, San Diego, CA 92126 and is currently estimated at $1,068,737, approximately $665 per square foot. 10983 Parkdale Ave is a home located in San Diego County with nearby schools including Hickman Elementary School, Challenger Middle School, and Mira Mesa High School.
Ownership History
Date
Name
Owned For
Owner Type
Purchase Details
Closed on
May 27, 2021
Sold by
Nguyen Tam Duy
Bought by
Nguyen Tam Duy and Tam Duy Nguyen Revocable Trust
Current Estimated Value
Home Financials for this Owner
Home Financials are based on the most recent Mortgage that was taken out on this home.
Original Mortgage
$426,000
Interest Rate
2.9%
Mortgage Type
New Conventional
Purchase Details
Closed on
Feb 19, 2019
Sold by
Nguyen Tam Duy
Bought by
Nguyen Tam Duy and Tam Duy Nguyen Revocable Trust
Home Financials for this Owner
Home Financials are based on the most recent Mortgage that was taken out on this home.
Original Mortgage
$214,200
Interest Rate
4.4%
Mortgage Type
New Conventional
Purchase Details
Closed on
Oct 31, 2014
Sold by
Nguyen Tam Duy
Bought by
Nguyen Tam Duy
Create a Home Valuation Report for This Property
The Home Valuation Report is an in-depth analysis detailing your home's value as well as a comparison with similar homes in the area
Home Values in the Area
Average Home Value in this Area
Purchase History
| Date | Buyer | Sale Price | Title Company |
|---|---|---|---|
| Nguyen Tam Duy | -- | Amrock Llc | |
| Nguyen Tam Duy | -- | Amrock Llc | |
| Nguyen Tam Duy | -- | Wfg National Title | |
| Nguyen Tam Duy | -- | Wfg Title Company Of Ca | |
| Nguyen Tam Duy | -- | None Available |
Source: Public Records
Mortgage History
| Date | Status | Borrower | Loan Amount |
|---|---|---|---|
| Closed | Nguyen Tam Duy | $426,000 | |
| Closed | Nguyen Tam Duy | $214,200 |
Source: Public Records
Tax History Compared to Growth
Tax History
| Year | Tax Paid | Tax Assessment Tax Assessment Total Assessment is a certain percentage of the fair market value that is determined by local assessors to be the total taxable value of land and additions on the property. | Land | Improvement |
|---|---|---|---|---|
| 2025 | $2,157 | $174,725 | $64,369 | $110,356 |
| 2024 | $2,157 | $171,300 | $63,107 | $108,193 |
| 2023 | $2,108 | $167,942 | $61,870 | $106,072 |
| 2022 | $2,051 | $164,650 | $60,657 | $103,993 |
| 2021 | $2,037 | $161,422 | $59,468 | $101,954 |
| 2020 | $2,012 | $159,768 | $58,859 | $100,909 |
| 2019 | $1,976 | $156,636 | $57,705 | $98,931 |
| 2018 | $1,850 | $153,566 | $56,574 | $96,992 |
| 2017 | $1,803 | $150,556 | $55,465 | $95,091 |
| 2016 | $1,773 | $147,605 | $54,378 | $93,227 |
| 2015 | $1,747 | $145,389 | $53,562 | $91,827 |
| 2014 | $1,721 | $142,542 | $52,513 | $90,029 |
Source: Public Records
Map
Nearby Homes
- 7561 Windsong Rd
- 7736 Alcamo Rd
- 8007 New Salem St
- 7387 New Salem St
- 10840 New Salem Point
- 11149 Blythe Rd
- 7646 Acama St
- 7636 Acama St
- 10840 Deering St
- 10692 Dabney Dr Unit 102
- 10948 Worthing Ave
- 11545 Caminito la Bar Unit 74
- 10668 Dabney Dr Unit 122
- 10668 Dabney Dr Unit 125
- 7385 Calle Cristobal Unit 225
- 7444 Mason Heights Ln
- 7758 Prairie Shadow Rd
- 7684 Adkins Way
- 7365 Calle Cristobal Unit 197
- 10785 Chinon Cir
- 10983 Parkdale Ave Unit ID1283139P
- 10985 Parkdale Ave Unit ID1283140P
- 10979 Parkdale Ave
- 10984 Salinas Way
- 10980 Salinas Way
- 10975 Parkdale Ave
- 7712 Parma Ln
- 7722 Parma Ln
- 10976 Salinas Way
- 10984 Parkdale Ave
- 10980 Parkdale Ave
- 10971 Parkdale Ave
- 7732 Parma Ln
- 10976 Parkdale Ave
- 10972 Salinas Way
- 7692 Parma Ln
- 7742 Parma Ln
- 10967 Parkdale Ave
- 10972 Parkdale Ave
- 7684 Parma Ln