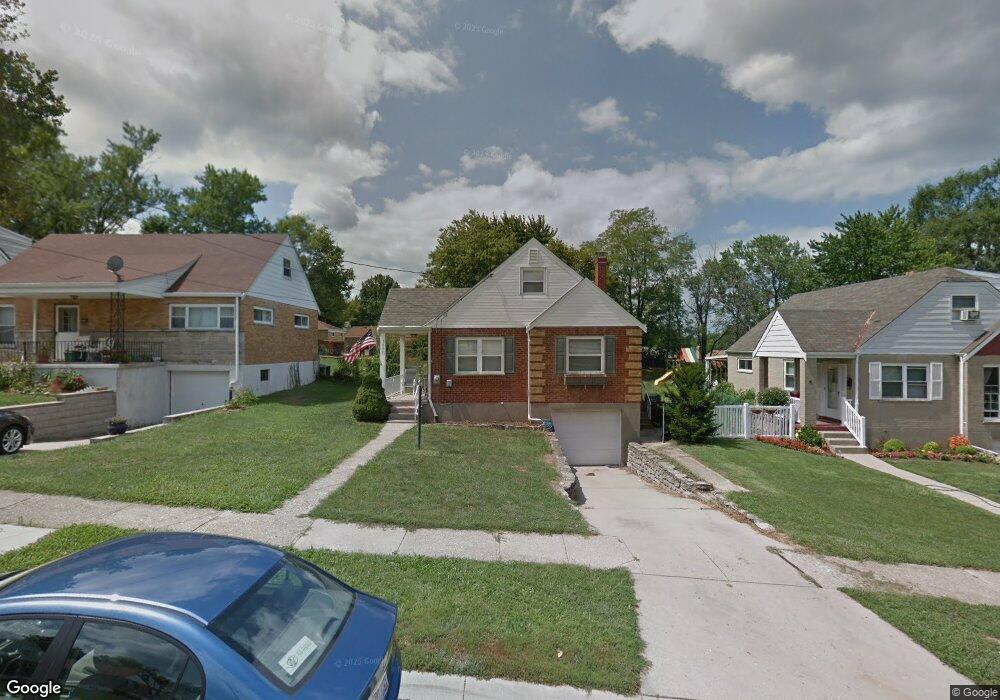
1099 Alcliff Ln Cincinnati, OH 45238
West Price Hill NeighborhoodEstimated Value: $202,000 - $220,539
3
Beds
2
Baths
1,314
Sq Ft
$163/Sq Ft
Est. Value
About This Home
This home is located at 1099 Alcliff Ln, Cincinnati, OH 45238 and is currently estimated at $213,885, approximately $162 per square foot. 1099 Alcliff Ln is a home located in Hamilton County with nearby schools including Covedale School, Gilbert A. Dater High School, and Western Hills High School.
Ownership History
Date
Name
Owned For
Owner Type
Purchase Details
Closed on
Oct 7, 2005
Sold by
Hetzel John and Hetzel Brenda L
Bought by
Kearns James F and Kearns Amy
Current Estimated Value
Home Financials for this Owner
Home Financials are based on the most recent Mortgage that was taken out on this home.
Original Mortgage
$112,665
Outstanding Balance
$59,045
Interest Rate
5.82%
Mortgage Type
Fannie Mae Freddie Mac
Estimated Equity
$154,840
Purchase Details
Closed on
Jun 20, 2001
Sold by
Hauser Brenda L and Hauser Brenda L
Bought by
Hetzel John and Hetzel Brenda L
Purchase Details
Closed on
Sep 13, 1996
Sold by
Hauser Dale C
Bought by
Hauser Brenda L
Purchase Details
Closed on
Sep 21, 1995
Sold by
Niehoff Barbara K
Bought by
Hauser Brenda L
Home Financials for this Owner
Home Financials are based on the most recent Mortgage that was taken out on this home.
Original Mortgage
$83,900
Interest Rate
7.78%
Mortgage Type
FHA
Create a Home Valuation Report for This Property
The Home Valuation Report is an in-depth analysis detailing your home's value as well as a comparison with similar homes in the area
Home Values in the Area
Average Home Value in this Area
Purchase History
We collect this data history from publicly available records. To have your information removed, we recommend requesting removal directly through your county’s website.
| Date | Buyer | Sale Price | Title Company |
|---|---|---|---|
| Kearns James F | -- | None Available | |
| Hetzel John | -- | -- | |
| Hauser Brenda L | -- | -- | |
| Hauser Brenda L | -- | -- |
Source: Public Records
Mortgage History
We collect this data history from publicly available records. To have your information removed, we recommend requesting removal directly through your county’s website.
| Date | Status | Borrower | Loan Amount |
|---|---|---|---|
| Open | Kearns James F | $112,665 | |
| Previous Owner | Hauser Brenda L | $83,900 |
Source: Public Records
Tax History
| Year | Tax Paid | Tax Assessment Tax Assessment Total Assessment is a certain percentage of the fair market value that is determined by local assessors to be the total taxable value of land and additions on the property. | Land | Improvement |
|---|---|---|---|---|
| 2025 | $2,853 | $46,173 | $5,751 | $40,422 |
| 2024 | $2,766 | $46,173 | $5,751 | $40,422 |
| 2023 | $2,829 | $46,173 | $5,751 | $40,422 |
| 2022 | $1,957 | $28,581 | $5,712 | $22,869 |
| 2021 | $1,880 | $28,581 | $5,712 | $22,869 |
| 2020 | $1,935 | $28,581 | $5,712 | $22,869 |
| 2019 | $1,923 | $25,984 | $5,194 | $20,790 |
| 2018 | $1,926 | $25,984 | $5,194 | $20,790 |
| 2017 | $1,829 | $25,984 | $5,194 | $20,790 |
| 2016 | $2,123 | $29,750 | $5,551 | $24,199 |
| 2015 | $1,914 | $29,750 | $5,551 | $24,199 |
| 2014 | $1,928 | $29,750 | $5,551 | $24,199 |
| 2013 | $2,227 | $33,807 | $6,307 | $27,500 |
Source: Public Records
Map
Nearby Homes
- 1051 Alcliff Ln
- 1063 Anderson Ferry Rd
- 5165 Highview Dr
- 1046 Fashion Ave
- 5140 Willnet Dr
- 976 Woodbriar Ln
- 5114 Cleves Warsaw Pike
- 5433 Cleves Warsaw Pike
- 5308 Quailwood Ct
- 5032 Willnet Dr
- 5070 Western Hills Ave
- 1650 Colonial Dr
- 5005 Western Hills Ave
- 1088 Morado Dr
- 1368 Pennsbury Dr
- 1051 Wilderness Trail
- 990 Covedale Ave
- 5153 Dresden Ct
- 818 Woodyhill Dr
- 1175 Nancy Lee Ln
- 1095 Alcliff Ln
- 1103 Alcliff Ln
- 1091 Alcliff Ln
- 1109 Alcliff Ln
- 1113 Alcliff Ln
- 1087 Alcliff Ln
- 1156 Anderson Ferry Rd
- 1154 Anderson Ferry Rd
- 5290 Highview Dr
- 1094 Alcliff Ln
- 1152 Anderson Ferry Rd
- 1160 Anderson Ferry Rd
- 1117 Alcliff Ln
- 1150 Anderson Ferry Rd
- 1083 Alcliff Ln
- 5288 Highview Dr
- 1158 Anderson Ferry Rd
- 5287 Highview Dr
- 1121 Alcliff Ln
- 1079 Alcliff Ln
Your Personal Tour Guide
Ask me questions while you tour the home.