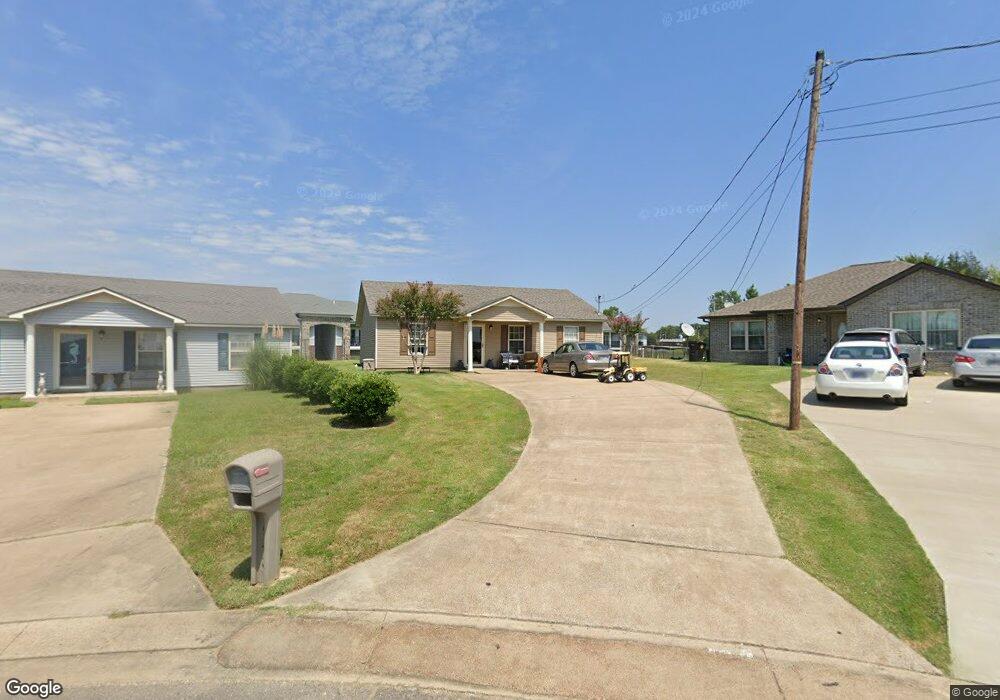
1099 Joshua Loop Dyersburg, TN 38024
Estimated Value: $157,000 - $307,000
--
Bed
2
Baths
1,248
Sq Ft
$171/Sq Ft
Est. Value
About This Home
This home is located at 1099 Joshua Loop, Dyersburg, TN 38024 and is currently estimated at $213,193, approximately $170 per square foot. 1099 Joshua Loop is a home located in Dyer County with nearby schools including Dyersburg Primary School, Trimble Elementary School, and Dyersburg Intermediate School.
Ownership History
Date
Name
Owned For
Owner Type
Purchase Details
Closed on
Jan 13, 2022
Sold by
Harper Jason P
Bought by
Jackson Anthony Wayde and Jackson Regina M
Current Estimated Value
Purchase Details
Closed on
Oct 26, 2021
Sold by
Harper Jason P
Bought by
Williams Dwight Steven and Williams Pattye J
Purchase Details
Closed on
Dec 11, 2013
Sold by
Stevens Robert T
Bought by
Harper Jason P
Purchase Details
Closed on
Aug 16, 2006
Sold by
Lemon Danny M
Bought by
Stevens Robert
Home Financials for this Owner
Home Financials are based on the most recent Mortgage that was taken out on this home.
Original Mortgage
$74,000
Interest Rate
6.73%
Purchase Details
Closed on
Jul 15, 2004
Bought by
Shaw Robert and Shaw Steve North
Purchase Details
Closed on
Nov 13, 1994
Bought by
Kirk Jere T and Kirk Marianne C
Create a Home Valuation Report for This Property
The Home Valuation Report is an in-depth analysis detailing your home's value as well as a comparison with similar homes in the area
Home Values in the Area
Average Home Value in this Area
Purchase History
| Date | Buyer | Sale Price | Title Company |
|---|---|---|---|
| Jackson Anthony Wayde | -- | Wilkerson & Gauldin | |
| Williams Dwight Steven | -- | None Listed On Document | |
| Harper Jason P | $65,500 | -- | |
| Stevens Robert | $80,000 | -- | |
| Shaw Robert | $29,300 | -- | |
| Kirk Jere T | -- | -- |
Source: Public Records
Mortgage History
| Date | Status | Borrower | Loan Amount |
|---|---|---|---|
| Previous Owner | Kirk Jere T | $74,000 |
Source: Public Records
Tax History Compared to Growth
Tax History
| Year | Tax Paid | Tax Assessment Tax Assessment Total Assessment is a certain percentage of the fair market value that is determined by local assessors to be the total taxable value of land and additions on the property. | Land | Improvement |
|---|---|---|---|---|
| 2024 | $657 | $26,725 | $2,575 | $24,150 |
| 2023 | $1,304 | $26,725 | $2,575 | $24,150 |
| 2022 | $1,280 | $26,725 | $2,575 | $24,150 |
| 2021 | $1,280 | $26,725 | $2,575 | $24,150 |
| 2020 | $1,266 | $26,725 | $2,575 | $24,150 |
| 2019 | $1,244 | $23,950 | $2,575 | $21,375 |
| 2018 | $1,201 | $23,950 | $2,575 | $21,375 |
| 2017 | $1,201 | $23,950 | $2,575 | $21,375 |
| 2016 | $1,011 | $23,950 | $2,575 | $21,375 |
| 2015 | $981 | $20,150 | $2,575 | $17,575 |
| 2014 | $954 | $20,150 | $2,575 | $17,575 |
Source: Public Records
Map
Nearby Homes
- 0 U S 51
- 1031 Dianne Dr
- 616 Isaac Hayes Dr
- 1980 & 1970 Brewer Rd
- 1590 Upper Finley Rd
- 76 Village St
- 1080 Valley Rd
- 1100 Wade Hampton Rd
- 1550 Laura Ln
- Lot 2 Laura Ln
- 22 Hampton Place
- 28 Hampton Place
- 2137 Aztec Dr
- 2023 Southwind Cove
- 2016 Forrest St
- 25 Hampton Place
- 808 Flicker Dr
- 983 Sir James Ave
- 26 Hampton Place
- 365 Revell Rd
- 2005 Joshua Loop
- 1095 Joshua Loop
- 2025 Joshua Loop
- 1085 Joshua Loop
- 2015 Joshua Loop
- 1070 Joshua Loop
- 1075 Joshua Loop
- 2035 Joshua Loop
- 1065 Joshua Loop
- 1060 Joshua Loop
- 1090 Caleb Dr
- 2045 Joshua Loop
- 1055 Joshua Loop
- 1050 Joshua Loop
- 2055 Joshua Loop
- 1080 Caleb Dr
- 1045 Joshua Loop
- 1040 Joshua Loop
- 1070 Caleb Dr
- 2001 Champions Dr