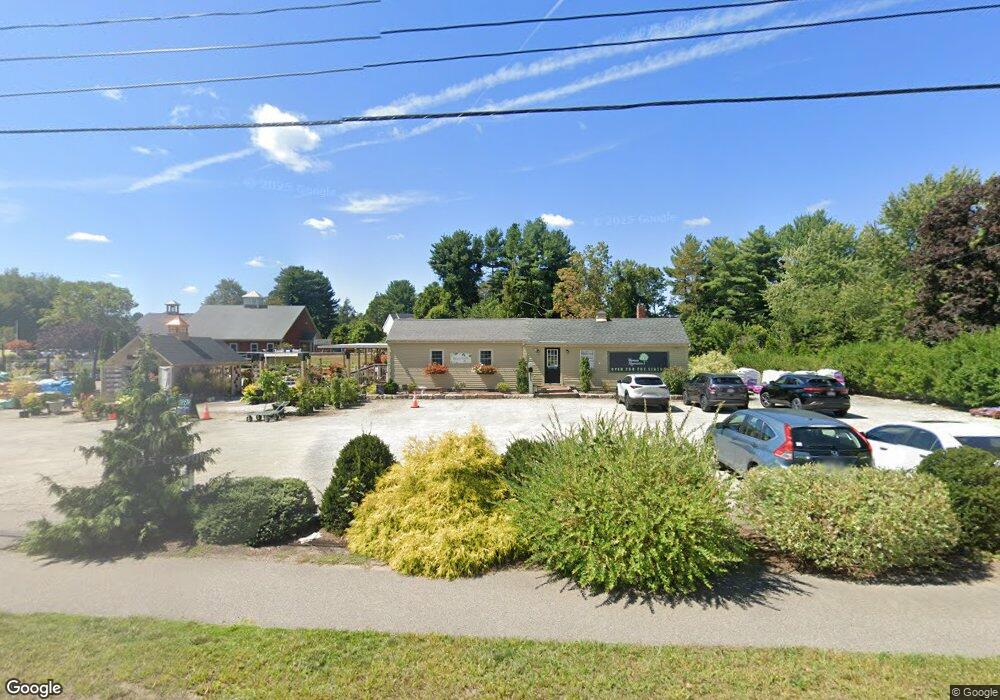
1099 Main St Hingham, MA 02043
South Hingham NeighborhoodEstimated Value: $1,421,425
Studio
--
Bath
844
Sq Ft
$1,684/Sq Ft
Est. Value
About This Home
This home is located at 1099 Main St, Hingham, MA 02043 and is currently estimated at $1,421,425, approximately $1,684 per square foot. 1099 Main St is a home located in Plymouth County with nearby schools including South Elementary School, Hingham Middle School, and Hingham High School.
Ownership History
Date
Name
Owned For
Owner Type
Purchase Details
Closed on
Feb 25, 2020
Sold by
Five Cousins Realty Llc
Bought by
Mezitt Properties Llc
Current Estimated Value
Home Financials for this Owner
Home Financials are based on the most recent Mortgage that was taken out on this home.
Original Mortgage
$376,000
Outstanding Balance
$332,211
Interest Rate
3.6%
Mortgage Type
New Conventional
Estimated Equity
$1,096,210
Purchase Details
Closed on
Dec 4, 2006
Sold by
Hingham Cmnty Nursery
Bought by
5 Cousins Llc
Purchase Details
Closed on
Aug 1, 2003
Sold by
Tomasi Steven R and Tomasi Cheryl L
Bought by
Five Cousins Realty Ll
Home Financials for this Owner
Home Financials are based on the most recent Mortgage that was taken out on this home.
Original Mortgage
$720,000
Interest Rate
5.28%
Mortgage Type
Commercial
Create a Home Valuation Report for This Property
The Home Valuation Report is an in-depth analysis detailing your home's value as well as a comparison with similar homes in the area
Home Values in the Area
Average Home Value in this Area
Purchase History
| Date | Buyer | Sale Price | Title Company |
|---|---|---|---|
| Mezitt Properties Llc | $900,000 | None Available | |
| 5 Cousins Llc | -- | -- | |
| Five Cousins Realty Ll | $850,000 | -- |
Source: Public Records
Mortgage History
| Date | Status | Borrower | Loan Amount |
|---|---|---|---|
| Open | Mezitt Properties Llc | $376,000 | |
| Previous Owner | Five Cousins Realty Ll | $400,000 | |
| Previous Owner | Five Cousins Realty Ll | $100,000 | |
| Previous Owner | Five Cousins Realty Ll | $720,000 |
Source: Public Records
Tax History
| Year | Tax Paid | Tax Assessment Tax Assessment Total Assessment is a certain percentage of the fair market value that is determined by local assessors to be the total taxable value of land and additions on the property. | Land | Improvement |
|---|---|---|---|---|
| 2025 | $8,310 | $777,400 | $657,100 | $120,300 |
| 2024 | $8,435 | $777,400 | $657,100 | $120,300 |
| 2023 | $7,774 | $777,400 | $657,100 | $120,300 |
| 2022 | $5,545 | $479,700 | $391,900 | $87,800 |
| 2021 | $5,415 | $458,900 | $371,800 | $87,100 |
| 2020 | $5,325 | $461,800 | $371,800 | $90,000 |
| 2019 | $5,454 | $461,800 | $371,800 | $90,000 |
| 2018 | $5,435 | $461,800 | $371,800 | $90,000 |
| 2017 | $5,324 | $434,600 | $350,300 | $84,300 |
| 2016 | $4,668 | $373,700 | $332,500 | $41,200 |
| 2015 | $4,682 | $373,700 | $332,500 | $41,200 |
Source: Public Records
Map
Nearby Homes
- 1 Kerri Ln
- 4 Kerri Ln
- 100 Whiting St
- 22 Longmeadow Rd
- 183 Gardner St
- 18 Whiting Ln
- 5 Old County Rd
- 17 Pine Haven Cir
- 9 Mast Hill Rd
- 214 Washington St Unit 24
- 214 Washington St Unit 28
- 18 Colby St
- 55 Turner Rd
- 5 Blueberry Ct
- 8 Blueberry Ct
- 251 Prospect St
- 2 Black Rock Dr Unit 21
- 2 Black Rock Dr
- 49 Washington Park Dr
- 18 Winterberry Ln
- 1095 Main St
- 6 Pinegrove Rd
- 1 Pinegrove Rd
- 4 Pinegrove Rd
- 4 Pine Grove Rd
- 1108 Main St
- 3 Pinegrove Rd
- 8 Pinegrove Rd
- 8 Pine Grove Rd
- 5 Pinegrove Rd
- 1083 Main St
- 1111 Main St
- 1111 Main St Unit 1111
- 1111 Main St Unit none
- 1120 Main St
- 1120 Main St Unit 1
- 1082 Main St
- 10 Pinegrove Rd
- 7 Pinegrove Rd
- 1079 Main St
Your Personal Tour Guide
Ask me questions while you tour the home.