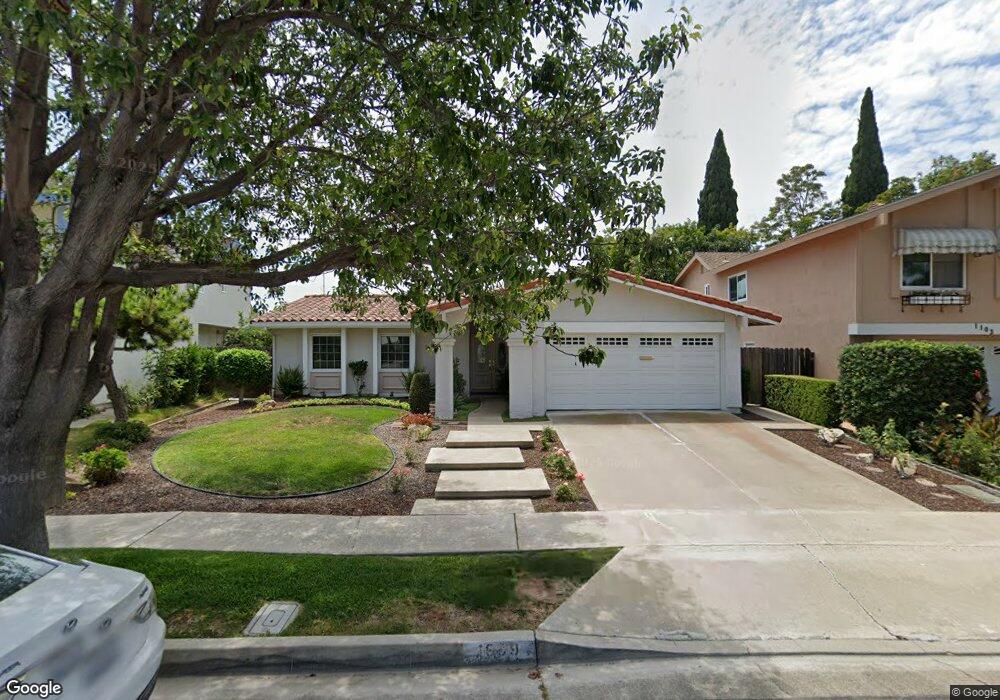
1099 Visalia Dr Costa Mesa, CA 92626
Northside Costa Mesa NeighborhoodEstimated Value: $1,209,907 - $1,425,000
3
Beds
2
Baths
1,683
Sq Ft
$795/Sq Ft
Est. Value
About This Home
This home is located at 1099 Visalia Dr, Costa Mesa, CA 92626 and is currently estimated at $1,338,227, approximately $795 per square foot. 1099 Visalia Dr is a home located in Orange County with nearby schools including Paularino Elementary School, Costa Mesa High School, and California Pacific Charter - San Diego.
Ownership History
Date
Name
Owned For
Owner Type
Purchase Details
Closed on
May 1, 2025
Sold by
Abce Llc
Bought by
Prendergast Mason K
Current Estimated Value
Home Financials for this Owner
Home Financials are based on the most recent Mortgage that was taken out on this home.
Original Mortgage
$1,080,000
Outstanding Balance
$1,076,190
Interest Rate
6.67%
Mortgage Type
New Conventional
Estimated Equity
$262,037
Purchase Details
Closed on
Mar 26, 2025
Sold by
Douglas Reid West and Douglas Mildred Kathleen
Bought by
Abce Llc
Home Financials for this Owner
Home Financials are based on the most recent Mortgage that was taken out on this home.
Original Mortgage
$1,080,000
Outstanding Balance
$1,076,190
Interest Rate
6.67%
Mortgage Type
New Conventional
Estimated Equity
$262,037
Purchase Details
Closed on
Jul 25, 2006
Sold by
West Douglas Reid and West Mildred Kathleen
Bought by
West Douglas Reid and West Mildred Kathleen
Create a Home Valuation Report for This Property
The Home Valuation Report is an in-depth analysis detailing your home's value as well as a comparison with similar homes in the area
Home Values in the Area
Average Home Value in this Area
Purchase History
| Date | Buyer | Sale Price | Title Company |
|---|---|---|---|
| Prendergast Mason K | $1,350,000 | Fidelity National Title | |
| Abce Llc | $1,100,000 | Fidelity National Title | |
| West Douglas Reid | -- | None Available | |
| West Douglas Reid | -- | None Available |
Source: Public Records
Mortgage History
| Date | Status | Borrower | Loan Amount |
|---|---|---|---|
| Open | Prendergast Mason K | $1,080,000 | |
| Closed | Abce Llc | $937,500 |
Source: Public Records
Tax History Compared to Growth
Tax History
| Year | Tax Paid | Tax Assessment Tax Assessment Total Assessment is a certain percentage of the fair market value that is determined by local assessors to be the total taxable value of land and additions on the property. | Land | Improvement |
|---|---|---|---|---|
| 2025 | $1,891 | $92,458 | $30,701 | $61,757 |
| 2024 | $1,891 | $90,646 | $30,099 | $60,547 |
| 2023 | $1,776 | $88,869 | $29,509 | $59,360 |
| 2022 | $1,634 | $87,127 | $28,930 | $58,197 |
| 2021 | $1,538 | $85,419 | $28,363 | $57,056 |
| 2020 | $1,508 | $84,544 | $28,073 | $56,471 |
| 2019 | $1,474 | $82,887 | $27,523 | $55,364 |
| 2018 | $1,443 | $81,262 | $26,983 | $54,279 |
| 2017 | $1,423 | $79,669 | $26,454 | $53,215 |
| 2016 | $1,399 | $78,107 | $25,935 | $52,172 |
| 2015 | $1,383 | $76,934 | $25,545 | $51,389 |
| 2014 | $1,355 | $75,427 | $25,044 | $50,383 |
Source: Public Records
Map
Nearby Homes
- 3375 Fuchsia St
- 3424 Summerset Cir
- 3493 San Marino Cir
- 1174 Kingston St
- 2511 W Sunflower Ave Unit K4
- 2511 W Sunflower Ave Unit P6
- 2511 W Sunflower Ave Unit P4
- 2738 W Keller Ave
- 2521 W Sunflower Ave Unit R1
- 2521 W Sunflower Ave Unit H2
- 2521 W Sunflower Ave Unit R8
- 2521 W Sunflower Ave Unit D4
- 973 Azalea Dr
- 2619 W Aurora St
- 3050 Madison Ave
- 3040 Fillmore Way
- 2542 W Macarthur Blvd Unit 134
- 2732 W Orion Ave
- 2619 W Orion Ave
- 3626 S Marine St
- 1095 Visalia Dr
- 1103 Visalia Dr
- 1074 Tulare Dr
- 1072 Tulare Dr
- 1091 Visalia Dr
- 1078 Tulare Dr
- 1070 Tulare Dr
- 1107 Visalia Dr
- 1080 Tulare Dr
- 1094 Visalia Dr
- 1090 Visalia Dr
- 1068 Tulare Dr
- 1087 Visalia Dr
- 1086 Visalia Dr
- 1111 Visalia Dr
- 1084 Tulare Dr
- 1066 Tulare Dr
- 1115 Visalia Dr
- 1083 Visalia Dr
- 1082 Visalia Dr