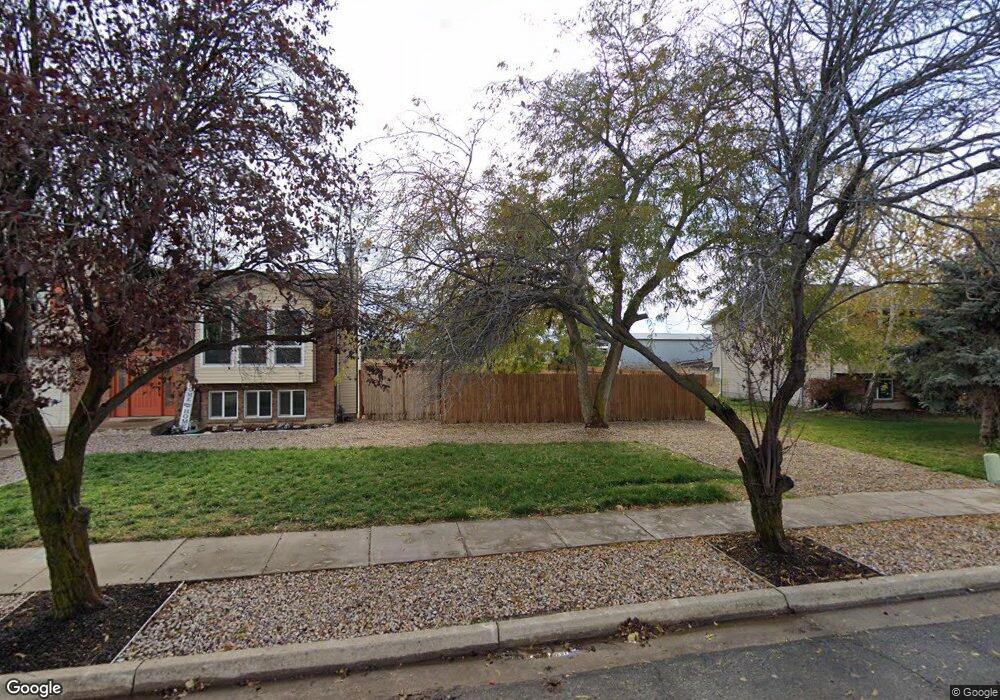
1099 W 650 S Layton, UT 84041
Estimated Value: $470,000 - $485,000
3
Beds
2
Baths
1,729
Sq Ft
$275/Sq Ft
Est. Value
About This Home
This home is located at 1099 W 650 S, Layton, UT 84041 and is currently estimated at $474,971, approximately $274 per square foot. 1099 W 650 S is a home located in Davis County with nearby schools including Heritage Elementary School, Shoreline Junior High School, and Layton High School.
Ownership History
Date
Name
Owned For
Owner Type
Purchase Details
Closed on
Mar 9, 2020
Sold by
Ramage Cameron
Bought by
Ramage Cameron and Ramage Mary
Current Estimated Value
Home Financials for this Owner
Home Financials are based on the most recent Mortgage that was taken out on this home.
Original Mortgage
$198,250
Outstanding Balance
$175,201
Interest Rate
3.5%
Mortgage Type
New Conventional
Estimated Equity
$299,770
Purchase Details
Closed on
Jul 16, 2018
Sold by
Us Bank Na
Bought by
Ramage Cameron
Home Financials for this Owner
Home Financials are based on the most recent Mortgage that was taken out on this home.
Original Mortgage
$196,000
Interest Rate
4.5%
Mortgage Type
New Conventional
Purchase Details
Closed on
Dec 27, 2017
Sold by
Low Garth R and Low Lois H
Bought by
Rmac Trust
Purchase Details
Closed on
May 30, 1997
Sold by
Carver John M and Carver Paige H
Bought by
Low Garth R
Home Financials for this Owner
Home Financials are based on the most recent Mortgage that was taken out on this home.
Original Mortgage
$77,000
Interest Rate
8%
Create a Home Valuation Report for This Property
The Home Valuation Report is an in-depth analysis detailing your home's value as well as a comparison with similar homes in the area
Home Values in the Area
Average Home Value in this Area
Purchase History
| Date | Buyer | Sale Price | Title Company |
|---|---|---|---|
| Ramage Cameron | -- | Aspen Title Insurance | |
| Ramage Cameron | $245,000 | Servicelink | |
| Rmac Trust | -- | Old Republic National Title | |
| Low Garth R | -- | Founders Title Company |
Source: Public Records
Mortgage History
| Date | Status | Borrower | Loan Amount |
|---|---|---|---|
| Open | Ramage Cameron | $198,250 | |
| Closed | Ramage Cameron | $196,000 | |
| Previous Owner | Low Garth R | $77,000 |
Source: Public Records
Tax History
| Year | Tax Paid | Tax Assessment Tax Assessment Total Assessment is a certain percentage of the fair market value that is determined by local assessors to be the total taxable value of land and additions on the property. | Land | Improvement |
|---|---|---|---|---|
| 2025 | $2,306 | $242,000 | $130,666 | $111,334 |
| 2024 | $2,159 | $228,250 | $140,162 | $88,088 |
| 2023 | $2,076 | $387,000 | $147,594 | $239,406 |
| 2022 | $2,255 | $228,251 | $86,312 | $141,939 |
| 2021 | $1,994 | $301,000 | $129,451 | $171,549 |
| 2020 | $1,795 | $260,000 | $110,490 | $149,510 |
| 2019 | $1,727 | $245,000 | $109,514 | $135,486 |
| 2018 | $1,489 | $212,000 | $96,474 | $115,526 |
| 2016 | $1,313 | $96,470 | $39,883 | $56,587 |
| 2015 | $1,295 | $88,110 | $39,883 | $48,227 |
| 2014 | $157 | $93,159 | $39,883 | $53,276 |
| 2013 | -- | $86,708 | $23,328 | $63,380 |
Source: Public Records
Map
Nearby Homes
- 1115 W 550 S
- 1354 W 725 S
- 1038 S Old Towne Rd
- 765 W Farming Way
- 1048 S Old Towne Rd
- 383 S 950 W
- 2056 W Phillips St
- 2011 Hill St
- 933 W Gentile St
- 356 Apple Leaf Ave
- 583 S Alberta Spruce Dr
- 322 Tessa Creek Way Unit 429
- 1281 S Grace Way
- 630 W 100 N
- 1124 S Neville St
- 1278 S Grace Way
- 418 W Gentile St
- 2109 W 200 N
- 1234 S Grace Way
- 80 E 850 S
Your Personal Tour Guide
Ask me questions while you tour the home.