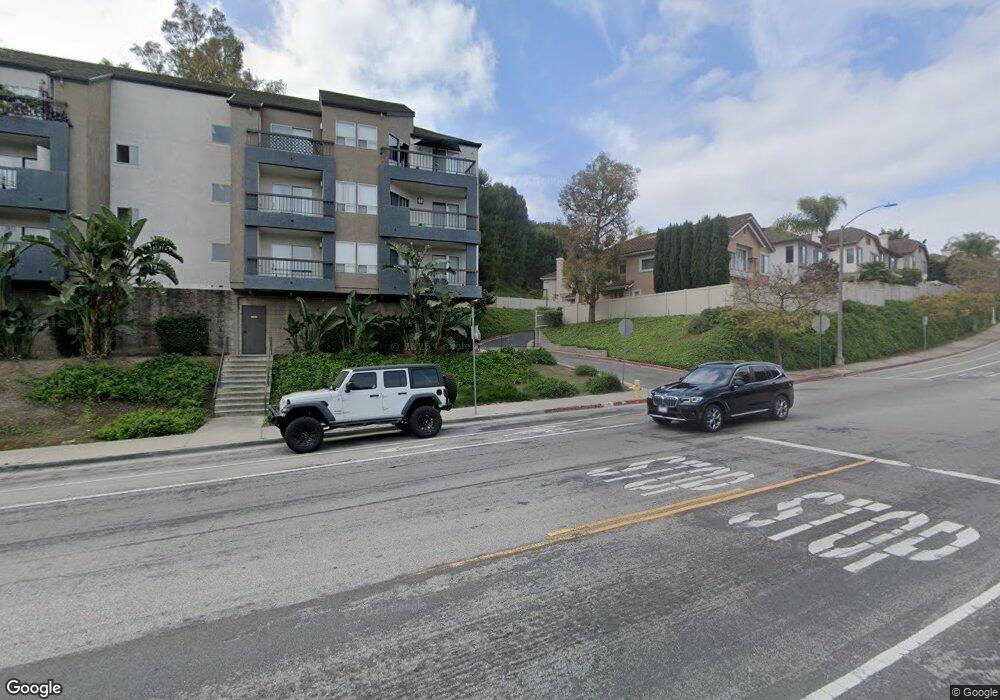
1099 W Capitol Dr Unit 220 San Pedro, CA 90731
Estimated Value: $522,980 - $681,000
2
Beds
2
Baths
983
Sq Ft
$604/Sq Ft
Est. Value
About This Home
This home is located at 1099 W Capitol Dr Unit 220, San Pedro, CA 90731 and is currently estimated at $593,245, approximately $603 per square foot. 1099 W Capitol Dr Unit 220 is a home located in Los Angeles County with nearby schools including Park Western Place Elementary School, Rudecinda Sepulveda Dodson Middle, and San Pedro Senior High School.
Ownership History
Date
Name
Owned For
Owner Type
Purchase Details
Closed on
Oct 25, 2018
Sold by
Bayridge Fee Owner Llc
Bought by
Manchester Square 2 Llc
Current Estimated Value
Home Financials for this Owner
Home Financials are based on the most recent Mortgage that was taken out on this home.
Original Mortgage
$12,000,000
Outstanding Balance
$7,537,949
Interest Rate
4.6%
Mortgage Type
Construction
Estimated Equity
-$6,944,704
Purchase Details
Closed on
Jan 15, 2015
Sold by
San Pedro Bay Ridge Llc
Bought by
Bayridge Fee Owners Llc
Purchase Details
Closed on
Sep 10, 2009
Sold by
Erp Operating Limited Partnership
Bought by
San Pedro Bay Ridge Llc
Home Financials for this Owner
Home Financials are based on the most recent Mortgage that was taken out on this home.
Original Mortgage
$6,400,000
Interest Rate
5.25%
Mortgage Type
Purchase Money Mortgage
Create a Home Valuation Report for This Property
The Home Valuation Report is an in-depth analysis detailing your home's value as well as a comparison with similar homes in the area
Home Values in the Area
Average Home Value in this Area
Purchase History
| Date | Buyer | Sale Price | Title Company |
|---|---|---|---|
| Manchester Square 2 Llc | $20,500,000 | First American Title Insuran | |
| Bayridge Fee Owners Llc | $13,510,000 | First American Title Ins Co | |
| San Pedro Bay Ridge Llc | -- | None Available |
Source: Public Records
Mortgage History
| Date | Status | Borrower | Loan Amount |
|---|---|---|---|
| Open | Manchester Square 2 Llc | $12,000,000 | |
| Previous Owner | San Pedro Bay Ridge Llc | $6,400,000 |
Source: Public Records
Tax History Compared to Growth
Tax History
| Year | Tax Paid | Tax Assessment Tax Assessment Total Assessment is a certain percentage of the fair market value that is determined by local assessors to be the total taxable value of land and additions on the property. | Land | Improvement |
|---|---|---|---|---|
| 2025 | $2,415 | $190,529 | $131,710 | $58,819 |
| 2024 | $2,415 | $186,794 | $129,128 | $57,666 |
| 2023 | $2,371 | $183,133 | $126,597 | $56,536 |
| 2022 | $4,825 | $399,446 | $199,723 | $199,723 |
| 2021 | $4,764 | $391,614 | $195,807 | $195,807 |
| 2019 | $4,621 | $380,000 | $190,000 | $190,000 |
| 2018 | $3,362 | $268,290 | $107,738 | $160,552 |
| 2016 | $3,208 | $257,873 | $103,555 | $154,318 |
| 2015 | $2,676 | $194,316 | $77,725 | $116,591 |
| 2014 | $2,466 | $190,511 | $76,203 | $114,308 |
Source: Public Records
Map
Nearby Homes
- 1129 W Capitol Dr Unit 7
- 1737 Roseglen Ave
- 1211 W Capitol Dr Unit 73
- 1301 Via Sebastian Unit 24
- 1319 Mount Rainier Rd
- 1410 Brett Place Unit 338
- 1410 Brett Place Unit 138
- 1282 Stonewood Ct
- 1330 Stonewood Ct
- 783 Gatun St Unit 245
- 1958 Mount Shasta Dr
- 1984 Mount Shasta Dr
- 1310 W Park Western Dr Unit 155
- 1311 W Capitol Dr Unit 182
- 1448 Brett Place Unit 47
- 1432 Brett Place Unit 77
- 1428 Brett Place Unit 81
- 1430 Brett Place Unit 10
- 1430 Brett Place Unit 12
- 1216 Westmont Dr
- 1099 W Capitol Dr Unit 310
- 1099 W Capitol Dr Unit 309
- 1099 W Capitol Dr Unit 308
- 1099 W Capitol Dr Unit 307
- 1099 W Capitol Dr Unit 306
- 1099 W Capitol Dr Unit 305
- 1099 W Capitol Dr Unit 304
- 1099 W Capitol Dr Unit 303
- 1099 W Capitol Dr Unit 302
- 1099 W Capitol Dr Unit 301
- 1099 W Capitol Dr Unit 219
- 1099 W Capitol Dr Unit 218
- 1099 W Capitol Dr Unit 217
- 1099 W Capitol Dr Unit 216
- 1099 W Capitol Dr Unit 215
- 1099 W Capitol Dr Unit 118
- 1099 W Capitol Dr Unit 117
- 1099 W Capitol Dr Unit 116
- 1099 W Capitol Dr Unit 115
- 1099 W Capitol Dr Unit 114