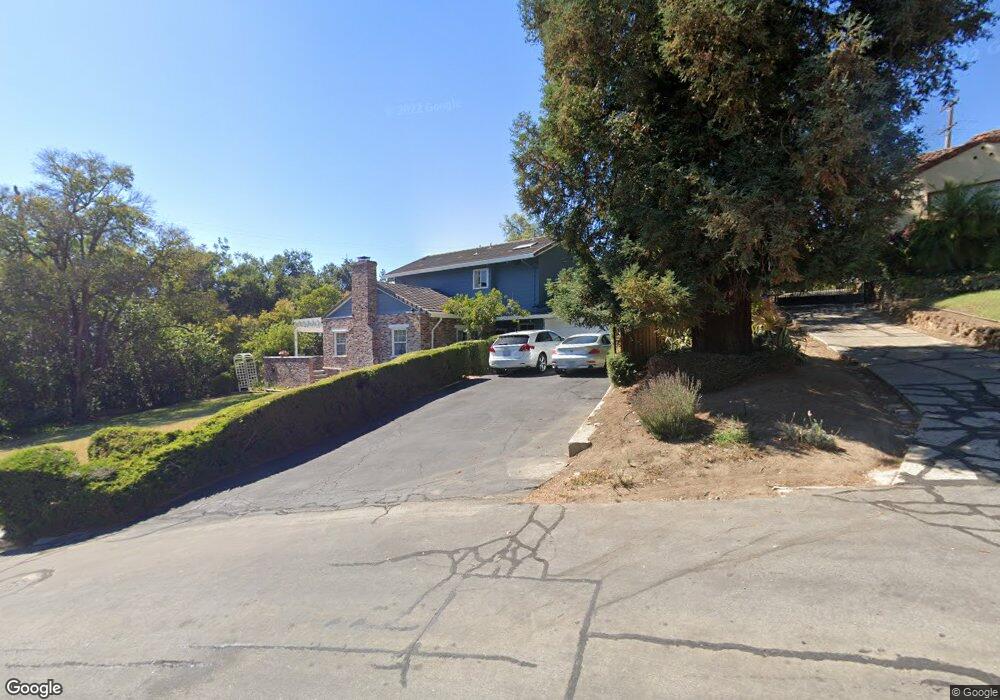
10995 Edgemont Dr San Jose, CA 95127
East Foothills NeighborhoodEstimated Value: $1,115,000 - $1,992,000
4
Beds
3
Baths
3,243
Sq Ft
$534/Sq Ft
Est. Value
About This Home
This home is located at 10995 Edgemont Dr, San Jose, CA 95127 and is currently estimated at $1,732,655, approximately $534 per square foot. 10995 Edgemont Dr is a home located in Santa Clara County with nearby schools including Linda Vista Elementary School, Joseph George Middle School, and James Lick High School.
Ownership History
Date
Name
Owned For
Owner Type
Purchase Details
Closed on
Sep 26, 2023
Sold by
Harper Timothy G and Harper Michele A
Bought by
Timothy G Harper And Michelle Ann Auran 2023 and Harper
Current Estimated Value
Purchase Details
Closed on
Dec 6, 2020
Sold by
Harper Timothy G
Bought by
Harper Timothy G and Auran Michele A
Home Financials for this Owner
Home Financials are based on the most recent Mortgage that was taken out on this home.
Original Mortgage
$300,000
Interest Rate
2.8%
Mortgage Type
New Conventional
Purchase Details
Closed on
Dec 2, 2020
Sold by
Harper Timothy G
Bought by
Harper Timothy G and Auran Michele A
Home Financials for this Owner
Home Financials are based on the most recent Mortgage that was taken out on this home.
Original Mortgage
$300,000
Interest Rate
2.8%
Mortgage Type
New Conventional
Purchase Details
Closed on
Dec 17, 1996
Sold by
Lillback Kenneth C and Lillback D M
Bought by
Harper Timothy G
Home Financials for this Owner
Home Financials are based on the most recent Mortgage that was taken out on this home.
Original Mortgage
$400,000
Interest Rate
5.32%
Create a Home Valuation Report for This Property
The Home Valuation Report is an in-depth analysis detailing your home's value as well as a comparison with similar homes in the area
Home Values in the Area
Average Home Value in this Area
Purchase History
| Date | Buyer | Sale Price | Title Company |
|---|---|---|---|
| Timothy G Harper And Michelle Ann Auran 2023 | -- | None Listed On Document | |
| Harper Timothy G | -- | First American Title Company | |
| Harper Timothy G | -- | First American Title | |
| Harper Timothy G | $500,000 | Fidelity National Title Co |
Source: Public Records
Mortgage History
| Date | Status | Borrower | Loan Amount |
|---|---|---|---|
| Previous Owner | Harper Timothy G | $300,000 | |
| Previous Owner | Harper Timothy G | $300,000 | |
| Previous Owner | Harper Timothy G | $400,000 |
Source: Public Records
Tax History Compared to Growth
Tax History
| Year | Tax Paid | Tax Assessment Tax Assessment Total Assessment is a certain percentage of the fair market value that is determined by local assessors to be the total taxable value of land and additions on the property. | Land | Improvement |
|---|---|---|---|---|
| 2025 | $11,280 | $814,321 | $366,444 | $447,877 |
| 2024 | $11,280 | $798,355 | $359,259 | $439,096 |
| 2023 | $11,133 | $782,702 | $352,215 | $430,487 |
| 2022 | $10,855 | $767,356 | $345,309 | $422,047 |
| 2021 | $10,499 | $752,311 | $338,539 | $413,772 |
| 2020 | $10,272 | $744,598 | $335,068 | $409,530 |
| 2019 | $10,004 | $729,999 | $328,499 | $401,500 |
| 2018 | $9,953 | $715,686 | $322,058 | $393,628 |
| 2017 | $10,020 | $701,654 | $315,744 | $385,910 |
| 2016 | $9,453 | $687,897 | $309,553 | $378,344 |
| 2015 | $9,472 | $677,565 | $304,904 | $372,661 |
| 2014 | $9,248 | $664,294 | $298,932 | $365,362 |
Source: Public Records
Map
Nearby Homes
- 15836 Highland Dr
- 0 Mt Hamilton Unit ML81974977
- 11080 Canyon Dr
- 11264 Chula Vista Ave
- 15821 Rica Vista Way
- 40 Valley View Ave
- 4155 Holly Dr
- 10741 Ridgeview Ave
- 770 Tallent Ave
- 0000 Altadena Ln
- 186 Mountain View Ave
- 0 Crothers Rd Unit ML82010195
- 550 Toyon Ave Unit 8
- 274 Vista Ave
- 14830 Corralitos Ln
- 3972 Pepper Tree Ln
- 15018 San Pablo Ave
- 0 Gordon Blvd Unit 231524
- 0 Gordon Blvd Unit FR25034343
- 0 Gordon Blvd Unit 625465
- 10991 Edgemont Dr
- 10987 Edgemont Dr
- 15720 Alum Rock Ave
- 10983 Edgemont Dr
- 15795 Highland Dr
- 10951 Edgemont Dr
- 15767 Highland Dr
- 10955 Edgemont Dr
- 10958 Edgemont Dr
- 10950 Miguelita Rd
- 10960 Edgemont Dr
- 10954 Edgemont Dr
- 10960 Brundage Way
- 15680 Alum Rock Ave
- 15766 Highland Dr
- 15780 Highland Dr
- 15725 Highland Dr
- 10970 Edgemont Dr
- 15794 Highland Dr
- 15752 Highland Dr