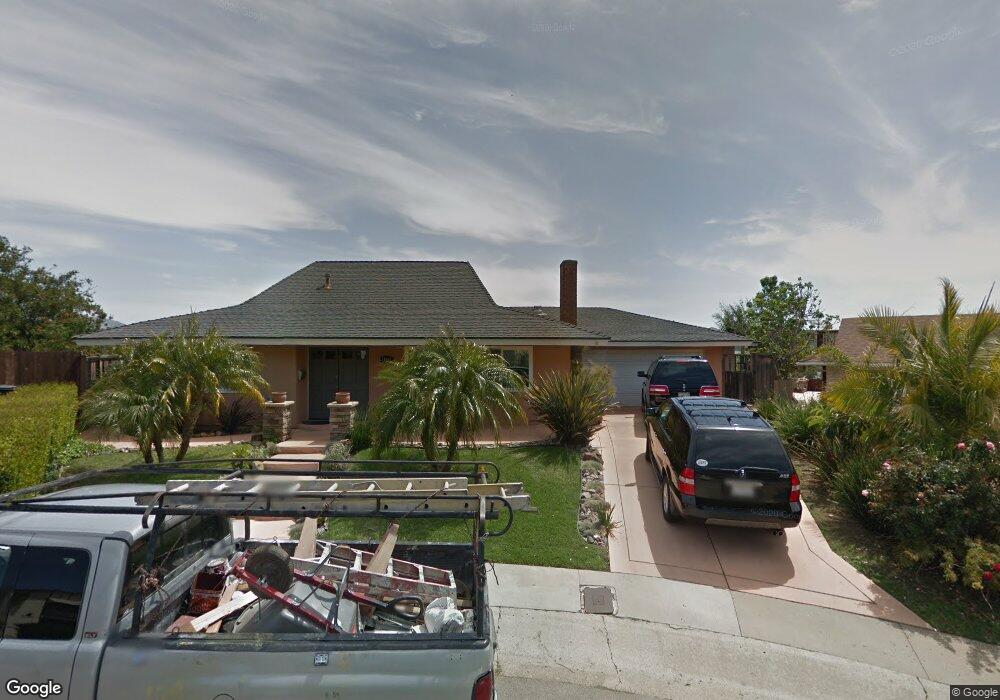
10995 Guadalimar Way San Diego, CA 92129
Rancho Peñasquitos NeighborhoodEstimated Value: $1,528,000 - $1,707,000
3
Beds
3
Baths
2,205
Sq Ft
$734/Sq Ft
Est. Value
About This Home
This home is located at 10995 Guadalimar Way, San Diego, CA 92129 and is currently estimated at $1,619,213, approximately $734 per square foot. 10995 Guadalimar Way is a home located in San Diego County with nearby schools including Rolling Hills Elementary School, Black Mountain Middle School, and Mt. Carmel High School.
Ownership History
Date
Name
Owned For
Owner Type
Purchase Details
Closed on
Feb 5, 2021
Sold by
Khattri Roli
Bought by
Khattri Roli and The Roli Khattri Trust
Current Estimated Value
Home Financials for this Owner
Home Financials are based on the most recent Mortgage that was taken out on this home.
Original Mortgage
$680,000
Outstanding Balance
$607,129
Interest Rate
2.6%
Mortgage Type
New Conventional
Estimated Equity
$1,012,084
Purchase Details
Closed on
Jul 23, 2018
Sold by
Brillantes Robert M and Brillantes Krisa J
Bought by
Khattri Roli and The Roli Khattri Trust
Home Financials for this Owner
Home Financials are based on the most recent Mortgage that was taken out on this home.
Original Mortgage
$693,600
Interest Rate
4.5%
Mortgage Type
New Conventional
Purchase Details
Closed on
Oct 19, 2006
Sold by
Brillantes Robert M and Brillantes Krisa J
Bought by
Brillantes Robert M and Brillantes Krisa J
Purchase Details
Closed on
Jun 19, 1992
Create a Home Valuation Report for This Property
The Home Valuation Report is an in-depth analysis detailing your home's value as well as a comparison with similar homes in the area
Home Values in the Area
Average Home Value in this Area
Purchase History
| Date | Buyer | Sale Price | Title Company |
|---|---|---|---|
| Khattri Roli | -- | Accommodation | |
| Khattri Roli | -- | Lawyers Title Ie | |
| Khattri Roli | $867,000 | Fidelity National Title | |
| Brillantes Robert M | -- | None Available | |
| -- | $164,900 | -- |
Source: Public Records
Mortgage History
| Date | Status | Borrower | Loan Amount |
|---|---|---|---|
| Open | Khattri Roli | $680,000 | |
| Closed | Khattri Roli | $693,600 |
Source: Public Records
Tax History Compared to Growth
Tax History
| Year | Tax Paid | Tax Assessment Tax Assessment Total Assessment is a certain percentage of the fair market value that is determined by local assessors to be the total taxable value of land and additions on the property. | Land | Improvement |
|---|---|---|---|---|
| 2025 | $10,653 | $967,151 | $669,309 | $297,842 |
| 2024 | $10,653 | $948,188 | $656,186 | $292,002 |
| 2023 | $10,425 | $929,597 | $643,320 | $286,277 |
| 2022 | $10,248 | $911,370 | $630,706 | $280,664 |
| 2021 | $10,112 | $893,501 | $618,340 | $275,161 |
| 2020 | $9,975 | $884,340 | $612,000 | $272,340 |
| 2019 | $9,792 | $867,000 | $600,000 | $267,000 |
| 2018 | $3,992 | $360,870 | $78,683 | $282,187 |
| 2017 | $3,884 | $353,795 | $77,141 | $276,654 |
| 2016 | $3,802 | $346,859 | $75,629 | $271,230 |
| 2015 | $3,744 | $341,649 | $74,493 | $267,156 |
| 2014 | $3,655 | $334,957 | $73,034 | $261,923 |
Source: Public Records
Map
Nearby Homes
- 14793 Penasquitos Dr
- Residence 2 Plan at Junipers - Woodlands
- Residence 1 Plan at Junipers - Lilac
- Residence 3 Plan at Junipers - Sycamore
- Residence 1 Plan at Junipers - Woodlands
- Residence 3 Plan at Junipers - Lilac
- Residence 2X Plan at Junipers - Lilac
- Residence 2 Plan at Junipers - Sycamore
- Residence 3 Plan at Junipers - Woodlands
- Residence 4 Plan at Junipers - Woodlands
- Residence 3X Plan at Junipers - Lilac
- Residence 2 Plan at Junipers - Lilac
- Residence 1 Plan at Junipers - Sycamore
- 15020 Penasquitos Dr
- 12251 Allison Way
- 12141 Paxton Way
- 12082 Gavin Way
- 12182 Paxton Way
- 12555 Taylor Way
- 12475 Miranda Way
- 10985 Guadalimar Way
- 10998 Guadalimar Way
- 10975 Guadalimar Way
- 14763 Penasquitos Dr
- 10990 Guadalimar Way
- 14753 Penasquitos Dr
- 14773 Penasquitos Dr
- 14734 Penasquitos Dr
- 10982 Guadalimar Way
- 14743 Penasquitos Dr
- 14783 Penasquitos Dr
- 10967 Guadalimar Way
- 10974 Guadalimar Way
- 14733 Penasquitos Dr
- 14724 Penasquitos Dr
- 10959 Guadalimar Way
- 10966 Guadalimar Way
- 14723 Penasquitos Dr
- 11039 Del Diablo St
- 14755 Penasquitos Ct